Enter your email address to download and customize presentations for free
Does your team put in real effort but still falls short of consistent results? Disciplined process management strengthens execution quality, improves cross-team coordination, and reveals where value is created or lost. Our presentation walks through the full process management cycle and shares practical tools to analyze workflows, refine decisions, and embed operational discipline across both simple processes and complex, multi-layered journeys.
Download free weekly presentations
Enter your email address to download and customize presentations for free
Not for commercial use
Download 'Process Management' presentation — 21 slides
+39 more presentations per quarter
that's $3 per presentation
/ Quarterly
Commercial use allowed. View other plans


Does your team put in real effort but still falls short of consistent results? As organizations face shifting priorities, rapid digitization, and pressure to do more with fewer resources, the gap between intent and execution has become a common tension. Disciplined Process Management can help narrow that gap with repeatable logic and measurable standards around how work moves from idea to outcome. It strengthens execution quality, improves cross-team coordination, and reveals where value is created or lost. Our presentation walks through the full Process Management cycle and shares practical tools to analyze workflows, refine decisions, and embed operational discipline across both simple processes and complex, multi-layered journeys.
When teams adopt Process Management at scale, they unlock faster throughput across functions, more reliable delivery under pressure, and sharper insight into what truly drives performance. These outcomes translate into stronger resilience, clearer trade-offs, and a more agile response to customer and market demands.
Download free weekly presentations
Enter your email address to download and customize presentations for free
Not for commercial use
Download 'Process Management' presentation — 21 slides
+39 more presentations per quarter
that's $3 per presentation
/ Quarterly
Commercial use allowed. View other plans
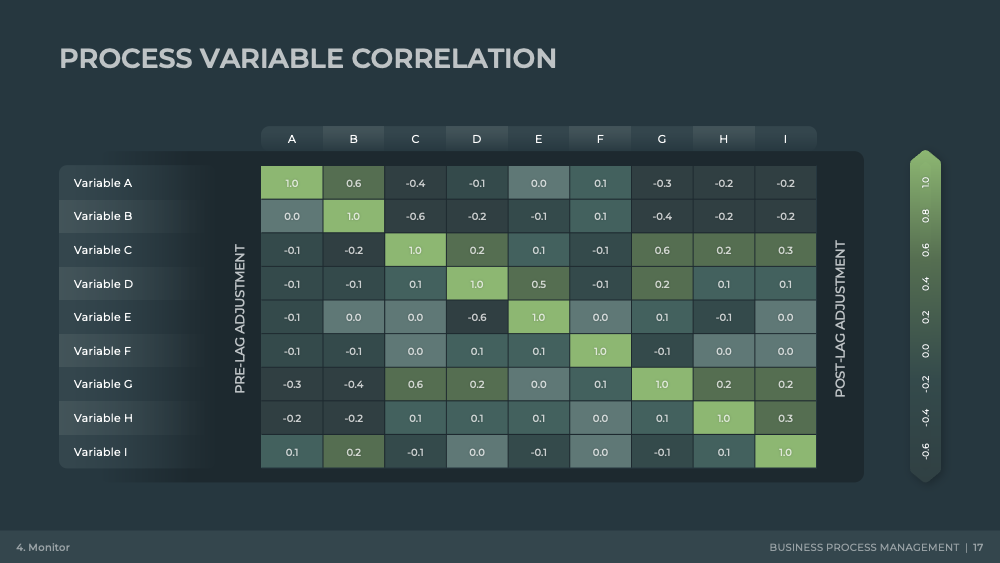
Process management succeeds only when teams have a clear view of how work flows today before any ambition for improvement takes shape. The SIPOC map captures suppliers, inputs, core activities, outputs, and customers in one coherent frame. Beyond documentation, SIPOC directs attention to where fragmentation exists across departments, where handoffs create friction, and where expectations between internal customers and the rest of the system do not align.
Value stream maps deepen that clarity as they surface the time dimension of the system. The map traces both value-added and non-value-added time across each major step, quantifying the real cost of delays that often appear invisible. In markets where product cycle compression or customer churn puts direct pressure on throughput, the ability to isolate long queues, uneven workloads, or extended approvals has direct strategic relevance.
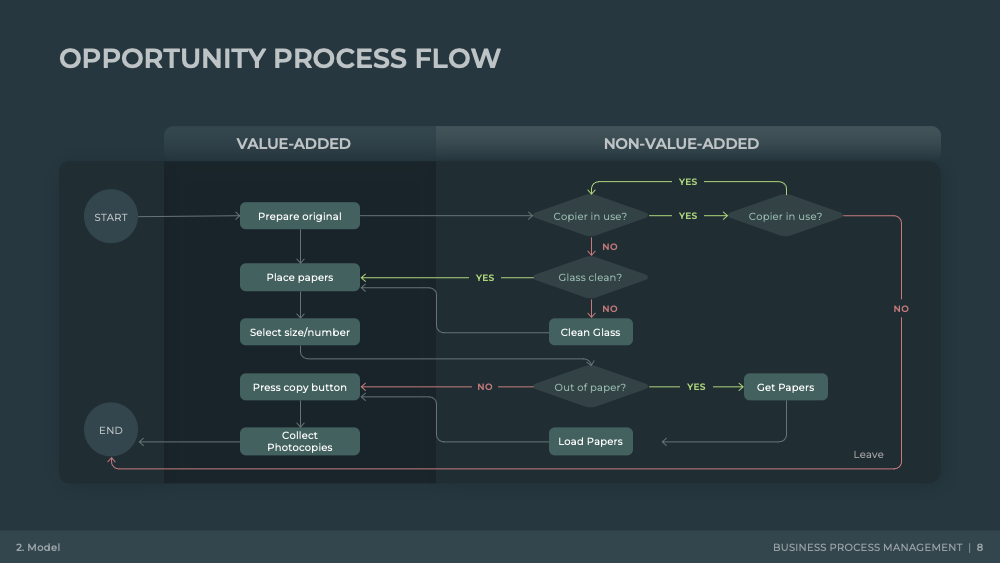
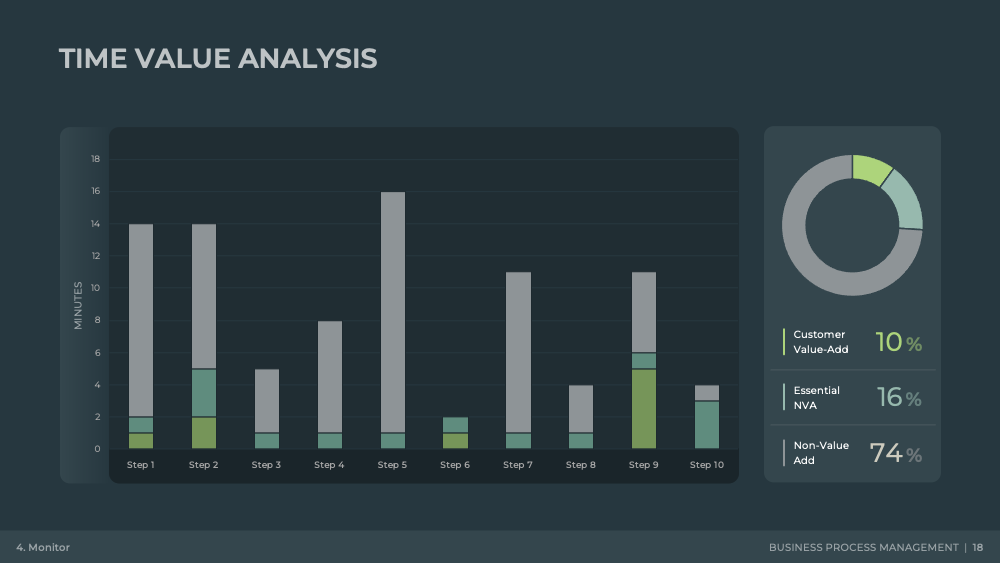
A third foundational tool comes from the value-added time analysis. It splits tasks into those that create customer value and those that only absorb resources. In organizations that face talent shortages or capital restrictions, this distinction helps teams free up scarce capacity. It also guides investment decisions by directing capital toward steps that raise throughput or quality rather than simply scale the cost base.
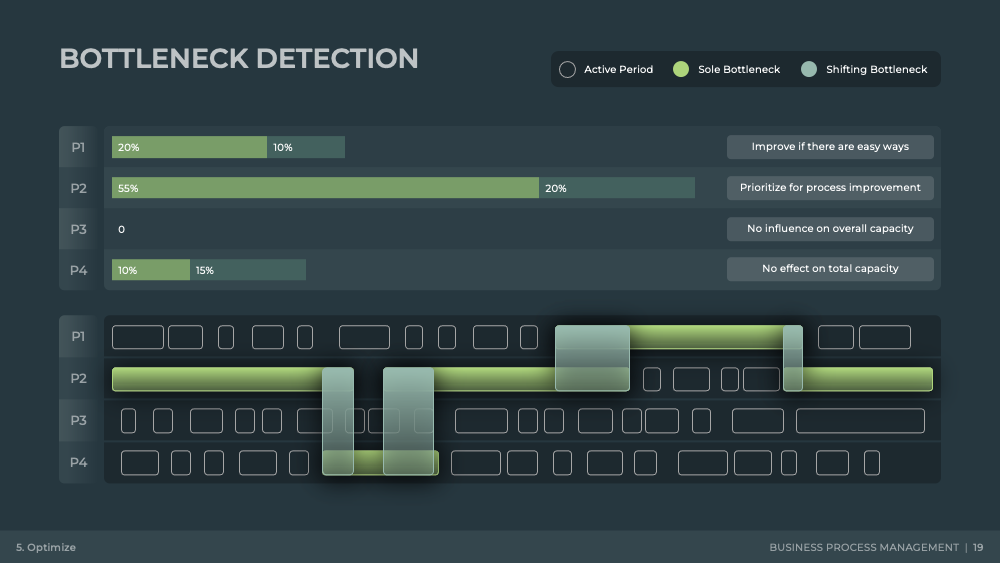
Once the foundational picture is clear, teams need a way to judge the distribution of work across functions and suppliers. The Yamazumi chart fulfills this role by exposing workload imbalances that skew team capacity. By visualizing each task, its duration, and whether it involves a new supplier or an existing one, the chart helps leaders detect whether certain functions face chronic overload or structural underutilization.
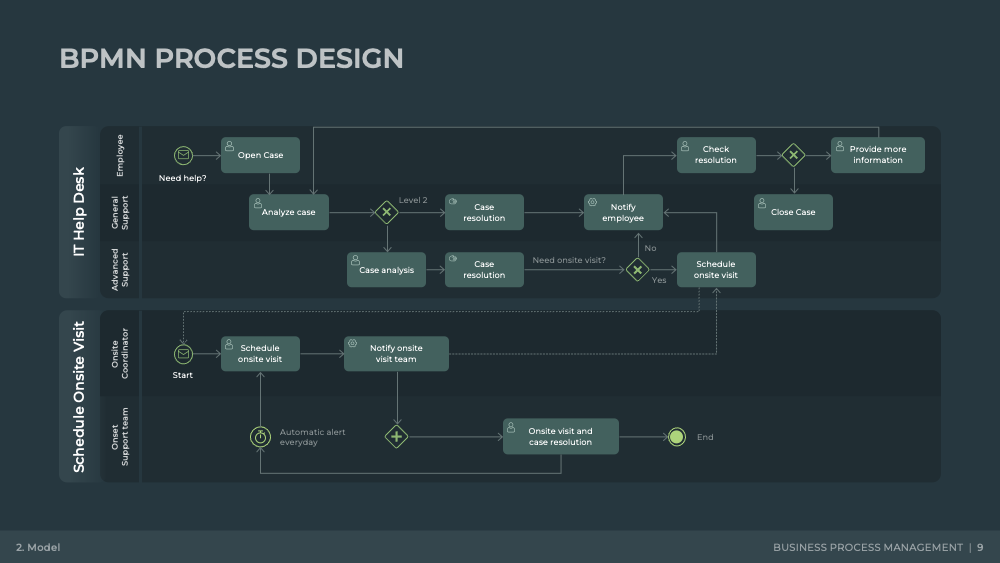
Cross-functional flows, such as those mapped in a swimlane process view, complement this picture by highlighting responsibility boundaries, decision points, and cyclical loops that create rework. A swimlane map does more than illustrate workflow. It exposes governance gaps that slow decisions or create inconsistent standards. In organizations that rely on cross-functional alignment to deliver complex portfolios, a swimlane map serves as an early warning system for friction that later manifests as delay, budget overrun, or quality drift.
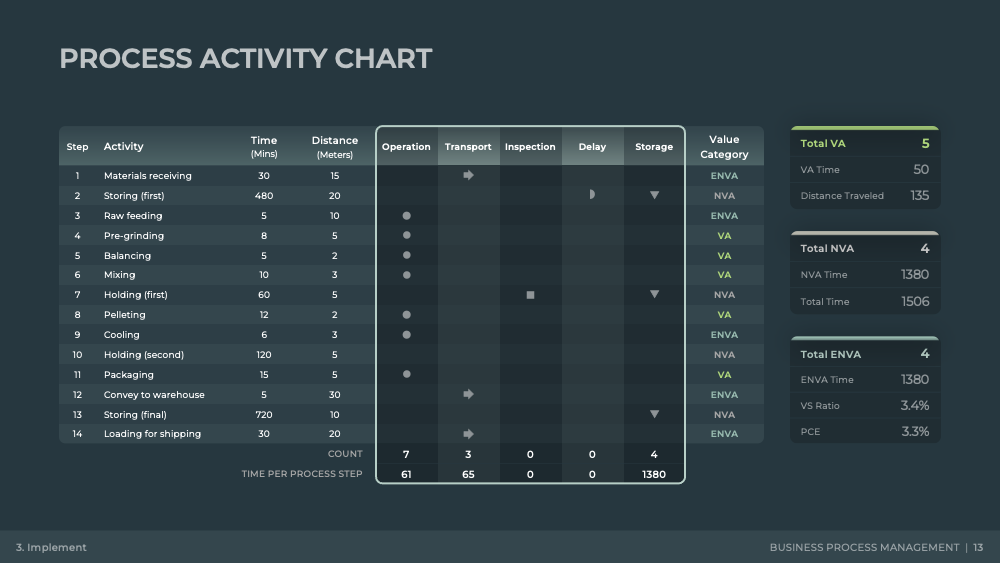
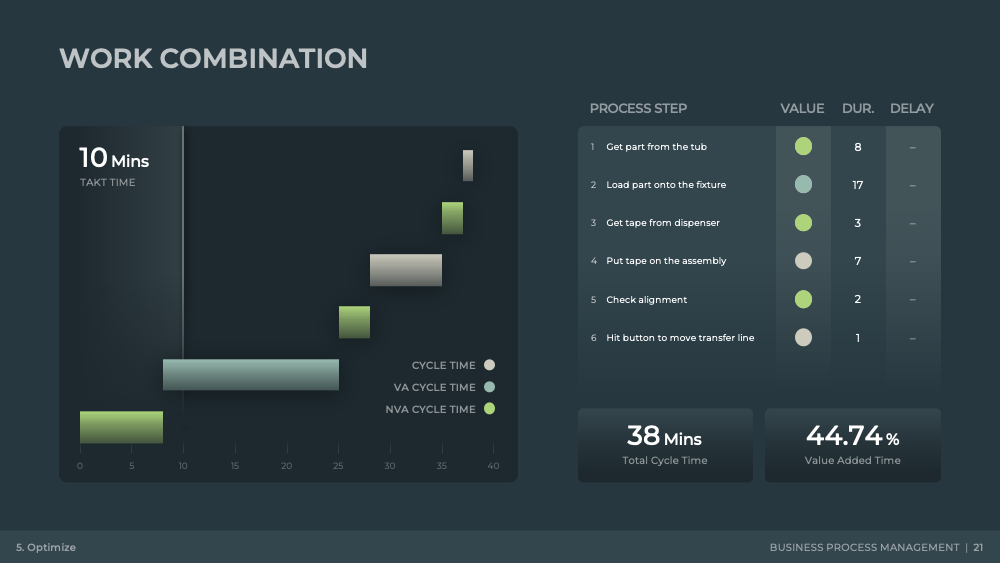
Cycle time analysis then sharpens the focus on the true speed of the system. By detailing how long each task requires and how units flow from one stage to the next, the analysis provides an empirical basis for productivity targets.
Download free weekly presentations
Enter your email address to download and customize presentations for free
Not for commercial use
Download 'Process Management' presentation — 21 slides
+39 more presentations per quarter
that's $3 per presentation
/ Quarterly
Commercial use allowed. View other plans
The stability analysis chart evaluates how consistent the system performs over time, revealing periods where variance spikes or declines. Unstable variance signals deeper issues that simple resource increases rarely fix. It points to fragmented standards, uneven training, or supplier inconsistency.
Benchmark comparisons further expand the analytical lens. By comparing internal metrics with industry standards or best-in-class peers, teams understand whether the root issue is internal inefficiency or broader structural pressure. Benchmarks create context for decisions on process redesign, automation investment, outsourcing, or capability upgrades. They also help avoid internal debates where stakeholders rely on anecdote rather than data. In a time when boards and investors demand clearer justification for operational spending, benchmark analysis provides a factual basis that bridges ambition and feasibility.
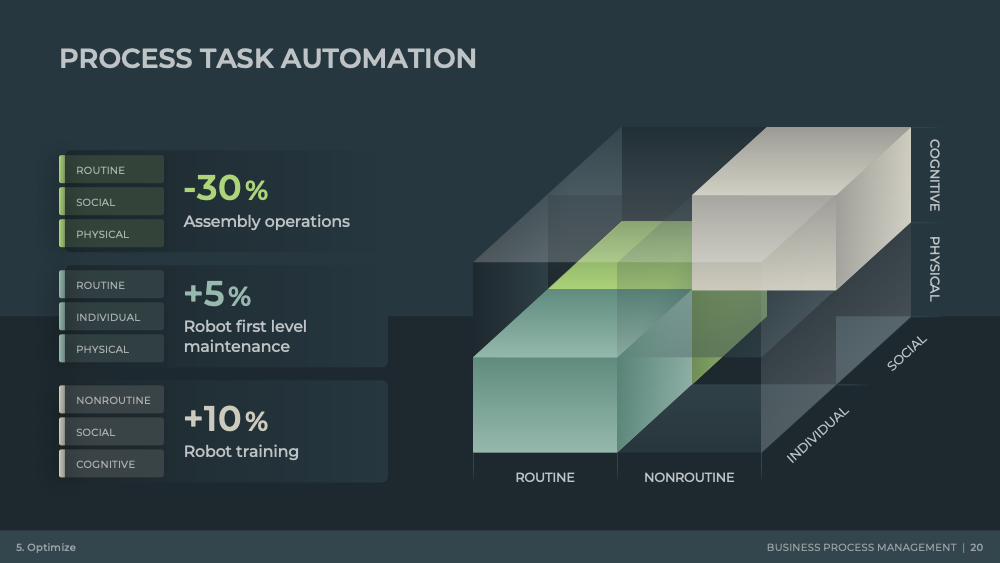
The process task automation view helps decode which tasks suit automation based on their routine, cognitive, physical, or social nature. In the current era where AI and robotics advance at rapid pace, organizations often pursue automation initiatives without a structured evaluation of where automation provides net value or where it creates quality or safety risk. The classification in the automation view gives leaders a grounded way to categorize tasks and judge automation potential with greater discipline. It helps teams avoid over-automation and focus instead on high-impact areas where the return is clear.
Work combination analysis ties this to human effort. By visualizing how operators perform tasks in sequence or parallel, the analysis surfaces ways to eliminate idle time, reduce unnecessary motion, or rebalance workload between individuals and machines. It supports the design of a more resilient labor model that avoids burnout while still raising throughput.
A disciplined process lens equips teams to act with greater intent, anchor decisions in evidence, and direct scarce resources toward steps that create real advantage. With clearer insight, sharper prioritization, and a more balanced operating rhythm, organizations position themselves for steadier performance and a stronger ability to scale what works.
Download free weekly presentations
Enter your email address to download and customize presentations for free
Not for commercial use
Download 'Process Management' presentation — 21 slides
+39 more presentations per quarter
that's $3 per presentation
/ Quarterly
Commercial use allowed. View other plans

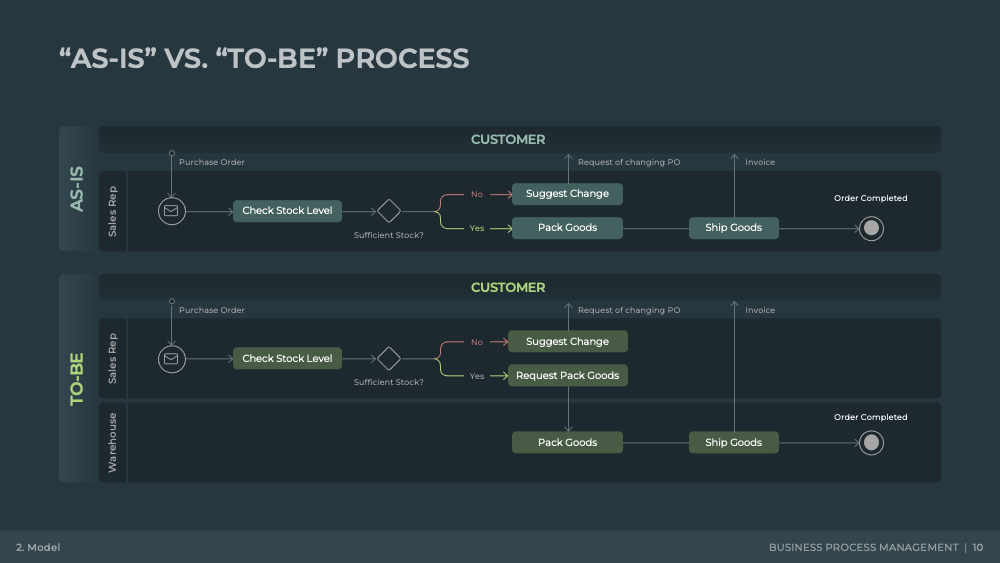
How do you cut costs and streamline workflows that are vital to your organization? Consider business process re-engineering, a systematic overhaul to rethink and redesign business processes from the ground up and dramatically improve performance. Use this management framework to transform your organization from purely functional to lean, process-oriented, and collaborative.

Want to generate the most business values with the least amount of time and cost? This Process Optimization presentation includes templates for tried-and-true methods to help trim the fat. Experiment with these methods to improve existing operations and get more accomplished in less time.

Want to reap the benefits of intelligent process automation? The rapid advancements in AI and Machine Learning offer new areas of opportunities and complexities for businesses and employees to explore. Use this presentation to navigate the use cases and long-term benefits that Workflow Automation can bring to the corporate world.

How to easily visualize, analyze, and optimize any business process or operation problems? This collection of process flow diagrams not only streamlines communication and enhances understanding across teams, but also facilitates significant improvements in efficiency and effectiveness.