The Industry Cost Curve, also known as the cost structure, is a graphical representation that shows the costs incurred by firms in an industry at different levels of output. It is used to analyze the competitive structure of an industry and the potential for profits. The curve can impact business decisions by providing insights into the profitability of increasing production, entering a new market, or changing pricing strategies. It can also help businesses understand their position in the market compared to competitors.
This question was asked on the following presentation:

Learn from some of the most useful and popular business strategies and frameworks from our compilation. Apply the content, diagram, and graphs from th...
Go to dashboard to download stunning resources
Download


Text this question was asked on:
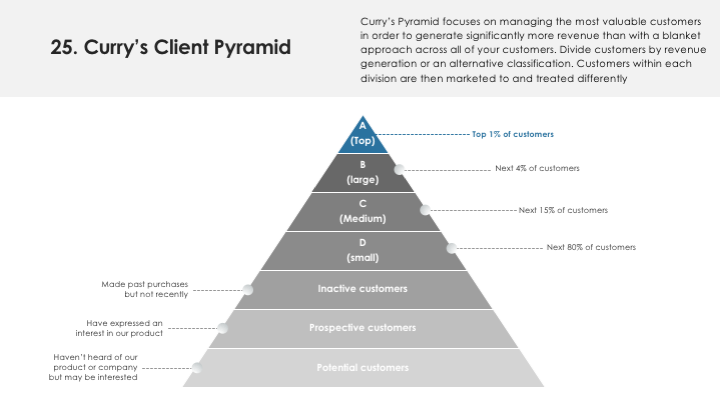
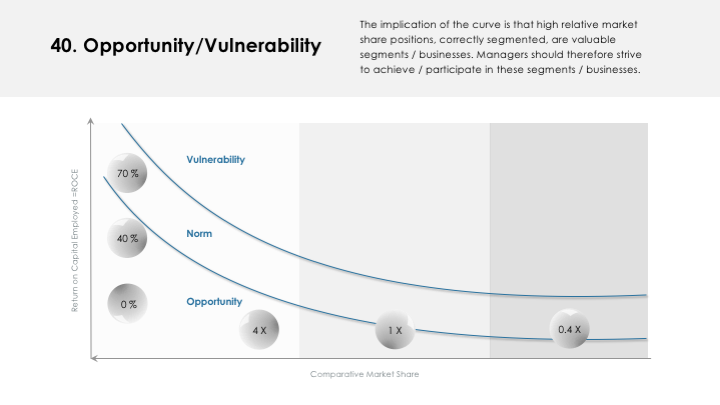
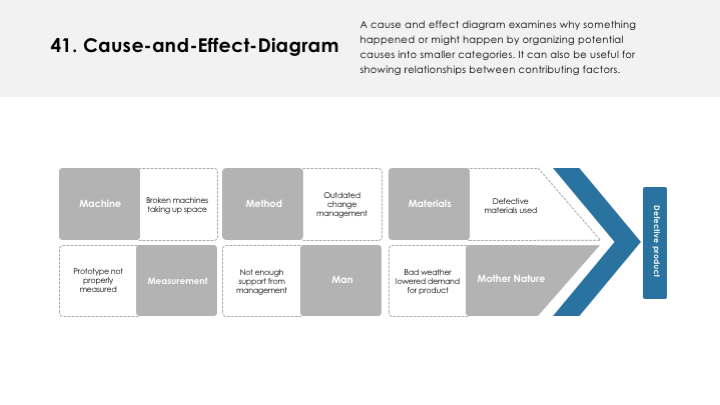
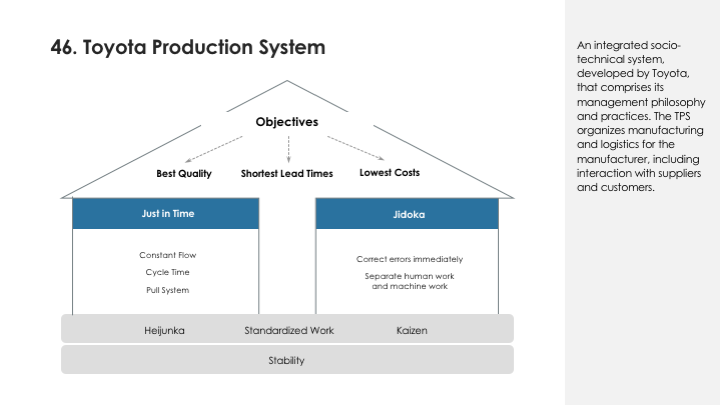
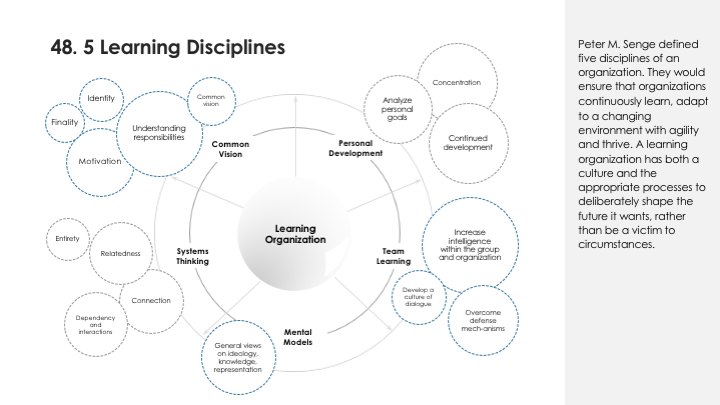
This deck includes the following business strategy frameworks: Strategic dialogue, , Value Disciplines, , Value-Based Management, Market Attractiveness Business position Assessment (MABA) Analysis, , Roadmapping, Big Hairy, Network Analysis, Value Stream Mapping, EFQM, Curry's Client, Branding Pentagram, Baldrige Excellence, 3C Strategic Triangle, Strategy Development Model, Hierarchy of Needs, Industry Cost Curve, , Opportunity/Vulnerability, Cause-and-Effect-Diagram, APQC Framework, Six Steps to Kaizen. Toyota Production System, Five Learning Disciplines and 5C Marketing Analysis.
 PowerPoint
 Google Slides
 Apple Keynote