Project Dashboard
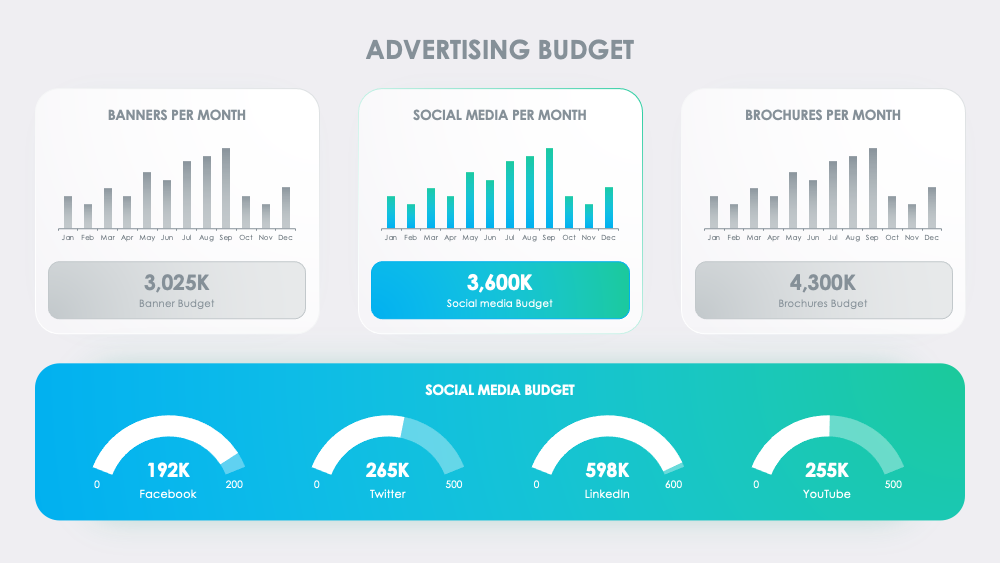
Referred to as 'Project Dashboard', this slide plays a pivotal role in the 'KPIs and Performance Metrics' presentation. It proficiently exhibits the project's current status and progress using visually engaging line graphs, bar charts, and pie charts. Rooted in metrics, it tracks and measures critical facets such as profit margins, fixed prices, and units sold. The Dashboard also encompasses competitive evaluation, steering the team towards concrete decision making and enthusing a sense of self-reliance. Let this slide guide your journey towards business objectives and unswerving accountability.
Download slide
KPIs and Performance Metrics
PowerPoint
30 Slides
KPIs and Performance Metrics
Apple Keynote
30 Slides
To continue, enter your email:
OR
Already have an account?
Log in
Preview

Full preview (30 Slides)