Slide of
KPI Dashboards (Part 1) Presentation
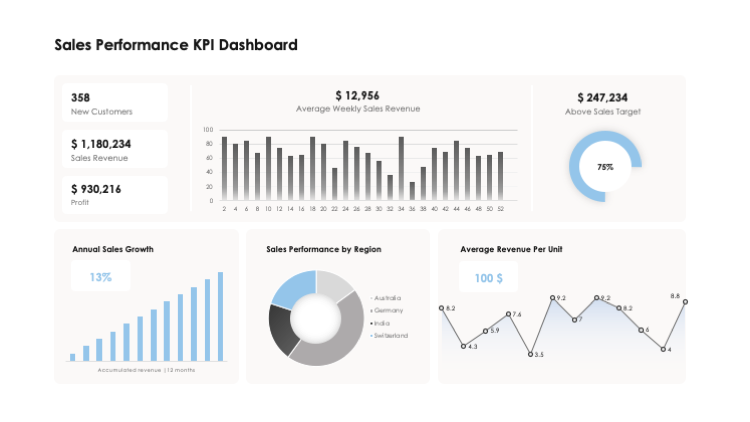
Sales Revenue & Leads KPI Dashboard
Unraveling the secrets within the Sales Revenue & Leads KPI Dashboard reveals a wealth of insights into lead-generation and revenue-creation. As an integral slide within the 'KPI Dashboards (Part 1)' presentation, it dissects lead sources and the subsequent revenue generated by diverse geographical areas. This slide also presents an overview of revenue and expenses, ensuring a comprehensive understanding of financial performance. Whether the audience is looking for insights into sales or project management, this slide proves to be an indispensable tool for learning and progress.
Download slide
KPI Dashboards (Part 1)
PowerPoint
30 Slides
KPI Dashboards (Part 1)
Apple Keynote
30 Slides
To continue, enter your email:
OR
Already have an account?
Log in
Preview

Full preview (30 Slides)