Tasks Dashboard
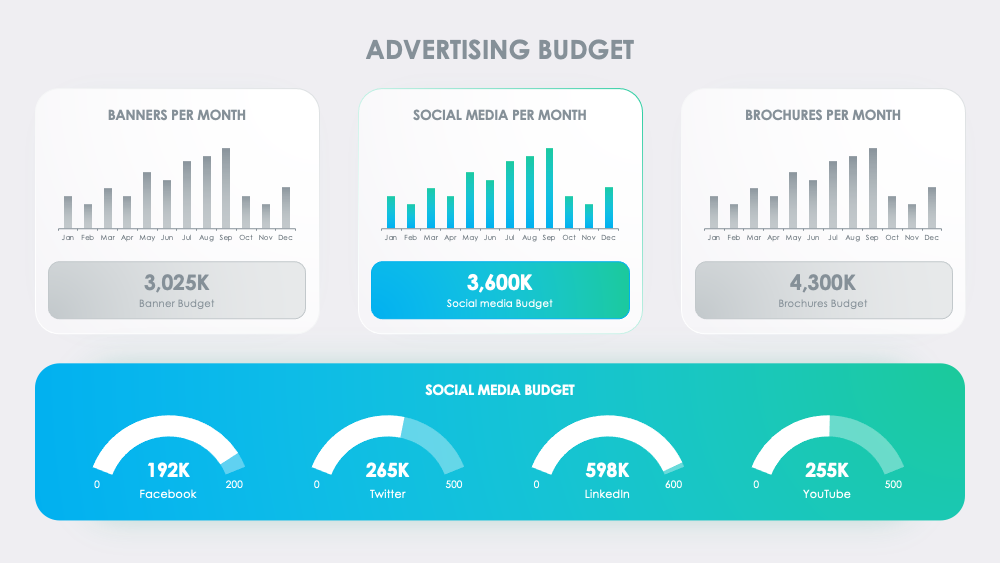
Captivating the significance of performance insights, the 'Tasks Dashboard' slide sits at the heart of the 'KPIs and Performance Metrics' presentation. Flaunting essential tools such as the burndown chart, line and combination graphs, even Gantt charts, this graphical marvel exemplifies the tracking and status monitoring of organizational tasks. Serving as a potent cue, it presents a comprehensive view of total hours involved and the ongoing evaluation of metrics. By revealing critical measurements within a dashboard layout, it fosters self-reliance in team members, ensuring that intricate decisions keep the strategic objectives in prime focus.
Download & customize
KPIs and Performance Metrics
PowerPoint
30 Slides
KPIs and Performance Metrics
Apple Keynote
30 Slides


Join You Exec
Access the full library of business templates

Get full access
[[-PAYWALL_PSQ_PRICE_MONTHLY_DISCOUNTED_FORMATTED-]]
per month
Billed quarterly
that's $3 per template
Join Plus[[-PAYWALL_PSY_PRICE_MONTHLY_DISCOUNTED_FORMATTED-]]
per month
Billed yearly
that's $2 per template
Join Plus[[-PAYWALL_P3Y_PRICE_MONTHLY_DISCOUNTED_FORMATTED-]]
per month
Billed every 3 years
that's $2 per template
Join Plus
Try for free
Download our free templates each week
No credit card required
Preview
Full preview (30 Slides)