Effective decision making is impossible without Key Performance Indicators (KPIs). One important thing to know about KPIs' "behavior" is that they constantly overlap and influence each other. Lay out your lead performance indicators alongside each other with our KPI Dashboards (Part 1) presentation and instantly analyze and communicate to your team the goals that are met regularly and those that need reevaluation.
The use of KPI Dashboards aligns with digital transformation initiatives in project management in several ways. Firstly, it enables real-time tracking and analysis of key performance indicators, which is crucial for effective decision making. This is a significant shift from traditional methods that often involve manual data collection and analysis. Secondly, KPI Dashboards facilitate clear communication of goals and performance metrics across the team, promoting transparency and accountability. Lastly, the use of such dashboards supports the shift towards data-driven decision making, a key aspect of digital transformation.
Almost any company can benefit from using KPI Dashboards, but let's take an example of a retail company. A retail company can use KPI Dashboards to track metrics like sales per hour, sales per employee, conversion rate, average transaction value, and customer satisfaction. These metrics can help the company identify areas of strength and weakness, monitor trends, and make informed decisions to improve performance. For instance, if the dashboard shows a low conversion rate, the company might need to invest in staff training or improve store layout. Similarly, a low average transaction value might indicate a need for upselling or cross-selling strategies.
Common challenges in applying KPI Dashboards include: selecting the right KPIs, data accuracy, data overload, and lack of understanding by users. These can be overcome by: ensuring KPIs align with business objectives, maintaining data integrity, presenting data in a user-friendly manner, and providing training and support to users.
View all 5 questions
Ask follow up
Download and customize this and 500+ other business templates
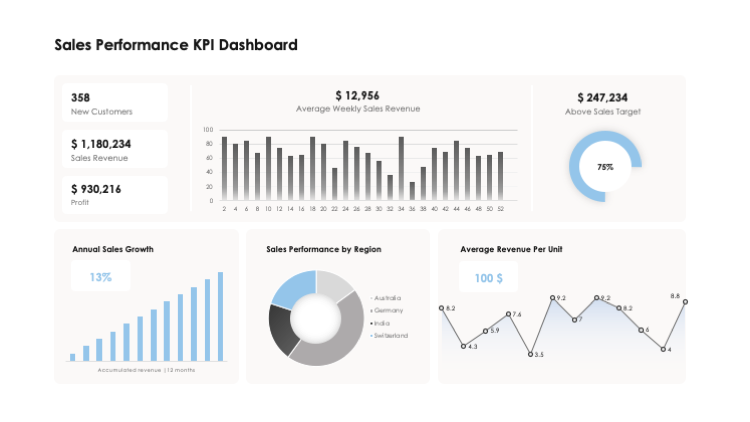
Setting up a KPI dashboard for financial metrics is an efficient way to keep track of an organization's business performance. Use this slide to reflect the results of revenue and profits measurements.
With this slide, communicate your venture's sales KPIs and results. Essential KPIs to include here: monthly sales growth, sales opportunities created, lead conversion rate and sales targets.
Measure and present your Project Status Report and keep your team and executives informed, using this slide. Include project timelines, budget, quality and effectiveness as your project management KPIs.
With this slide, share your customer-centric KPIs. These include Customer Satisfaction Score, Net Promoter Score (Part 2), First Response Time, Customer Retention Rate and Service + Quality.
KPI dashboards are effective tools for measuring and communicating business performance. They provide a visual representation of key performance indicators (KPIs) that reflect the health and success of a business. These dashboards can track various metrics across different departments, such as financial performance, sales, and project management. For instance, a financial KPI dashboard can monitor revenue and profits, while a sales dashboard might track monthly sales growth, lead conversion rates, and sales targets. Similarly, a project management dashboard could include project timelines, budget, quality, and effectiveness. By presenting this data in a clear and concise manner, KPI dashboards allow teams and executives to stay informed and make data-driven decisions.
Some customer-centric KPIs to include in a KPI dashboard are Customer Satisfaction Score, First Response Time, Customer Retention Rate, and Service + Quality.
A KPI dashboard can significantly aid in project management. It provides a visual representation of key performance indicators (KPIs) that can help in tracking the progress of a project. It can include project timelines, budget, quality, and effectiveness as your project management KPIs. This allows for real-time monitoring and quick adjustments if necessary. It also keeps the team and executives informed about the project's status, fostering transparency and accountability.
View all 5 questions
Ask follow up
Overview
A well-organized KPI dashboard ties all your performance indicators together in one place, so you can easily compare and analyze them. Because these indicators are usually divided into high-level and low-level KPIs, laying them out on a single dashboard helps to monitor the process of smaller goals flowing into bigger ones.
Yes, a Sales department can effectively utilize a KPI dashboard. They can track metrics like sales growth, sales target, customer acquisition cost, customer lifetime value, and sales by region or product. This will help them monitor their performance and make data-driven decisions. Similarly, a Human Resources department can use a KPI dashboard to track metrics like employee turnover rate, employee satisfaction, time to fill a position, and training effectiveness.
A KPI (Key Performance Indicator) dashboard assists in monitoring the process of smaller goals flowing into bigger ones by providing a centralized platform where all performance indicators are displayed. These indicators are usually divided into high-level and low-level KPIs. By laying them out on a single dashboard, it becomes easier to compare and analyze them, thereby tracking the progress of smaller goals and how they contribute to the achievement of larger objectives.
High-level KPIs are the overall goals and objectives of the organization, often tied to its strategic initiatives. They provide a big picture view of the company's performance. On the other hand, low-level KPIs are more operational and tactical, focusing on individual processes or tasks within departments. They help in monitoring the progress of smaller goals that contribute to the achievement of high-level KPIs.
View all 5 questions
Ask follow up
Download and customize this and 500+ other business templates
The experts from intelligent business performance firm, Bernard Marr & Co., list the following steps as essential when working on a KPI dashboard:
Keep your dashboard to a single screen – the goal of creating a KPI dashboard is to get a quick and concise survey of the business performance and potential threats.
Only include the most critical, insightful KPIs – this will force you and your team to really focus on the most important information about the venture's performance.
Make the dashboard easy to navigate and understand – don't dump as much information onto one page as you possibly can and make sure to arrange the data strategically, aesthetically and logically.
Concentrate on information delivery and comprehension – don't use intricate designs and don't introduce variety that doesn't provide much value, the experts recommend.
KPI dashboards are used across various business departments to track and measure performance against set goals. In finance, they might track metrics like revenue, profit margin, and operational costs. In sales, they could monitor sales growth, conversion rates, and customer acquisition costs. In project management, they might measure project completion rates, budget adherence, and resource utilization. The use of KPI dashboards in different departments allows for a comprehensive view of the organization's performance. However, the specific KPIs and their importance can vary significantly between departments based on their unique goals and functions.
A KPI dashboard can be made easy to navigate and understand by keeping it to a single screen and only including the most critical and insightful KPIs. This allows for a quick and concise survey of business performance and potential threats. The data should be arranged strategically, aesthetically, and logically to make the dashboard easy to navigate. Avoid using intricate designs and introducing variety that doesn't provide much value. The focus should be on information delivery and comprehension.
Creating a KPI dashboard can present several challenges. These include deciding which KPIs are most critical and insightful, ensuring the dashboard is easy to navigate and understand, and focusing on information delivery and comprehension. Overcoming these challenges involves a strategic approach. Firstly, you need to identify the most important KPIs that truly reflect your business performance. Secondly, the design of the dashboard should be simple and logical, avoiding unnecessary complexity. Lastly, avoid intricate designs and focus on delivering valuable information in a comprehensible manner.
View all 5 questions
Ask follow up
Statistics
According to the report conducted by The KPI Institute:
Performance Management Systems (PMS) are used by organizations worldwide mainly at operational (49%) and strategic level (39%)
The most common methodology used in structuring PMS is The Balanced Scorecard , as 42% of respondents admitted to using the tool
68% of respondents reported a positive impact on their business development once a KPI Framework was employed
32% of the respondents stated that the most challenging aspect in performance measurement is related to identifying the right KPIs for their business
The survey findings (32%) highlight organizational culture as being the premier factor when it comes to facilitating the implementation of a successful performance management system
33% of professionals said they integrate KPI results into their decision-making process, while support for a standardized template in which to report the implementation of decisions and initiatives only appears in 32% of cases
KPI results are integrated into the decision-making process of a business by using them as a measure of performance. They provide valuable insights into various aspects of the business, such as financial performance, sales, and project management. These insights can then be used to make informed decisions. For example, if a particular KPI is not meeting its target, the business can investigate the reasons behind this and take appropriate action. Similarly, if a KPI is exceeding its target, the business can look into why this is happening and potentially replicate the success in other areas. It's important to note that the effectiveness of integrating KPI results into the decision-making process depends on choosing the right KPIs for the business.
Organizational culture plays a crucial role in the successful implementation of a performance management system (PMS). A culture that values performance measurement and improvement can facilitate the adoption of a PMS by creating an environment where employees understand the importance of KPIs and are motivated to achieve them. This includes clear communication of goals, regular feedback, and recognition of achievements. Additionally, a culture that encourages learning and development can help employees see the PMS as a tool for personal and professional growth, rather than just a means of evaluation. Finally, a culture that promotes transparency and trust can ensure that the PMS is seen as fair and objective, which can increase employee buy-in and engagement.
Identifying the right KPIs for a business can be challenging due to several reasons. Firstly, it requires a clear understanding of the business objectives and goals. Without this, it's difficult to determine what should be measured. Secondly, there can be a lack of data or the inability to accurately measure certain aspects of the business. Thirdly, there can be too many potential KPIs, making it hard to focus on the ones that truly matter. Lastly, KPIs need to be relevant and applicable to the current business environment and strategy, which can change over time.
View all 5 questions
Ask follow up
Download and customize this and 500+ other business templates