Enter your email address to download and customize presentations for free
Why do some well-intended decisions devolve into costly failures down the line? Systems thinking tackles this setback and shows how structural variables connect and influence each other. Our presentation covers the foundational capabilities of systems thinking and their implementation tools. Use the framework to understand interrelationships, reduce blind spots in feedback loops, and assess mental models that shape organizational behavior.
Download free weekly presentations
Enter your email address to download and customize presentations for free
Not for commercial use
Download 'Systems Thinking' presentation — 22 slides
+39 more presentations per quarter
that's $3 per presentation
/ Quarterly
Commercial use allowed. View other plans


Why do some well-intended decisions devolve into costly long-term failures? The initial positive outcomes of immediate fixes can be deceptive as they mask deeper structural issues. Systems Thinking tackles this setback and shows how parts of a system connect and influence each other. Our presentation covers the five foundational capabilities of Systems Thinking and their practical implementation tools. Use the framework to understand interrelationships, reduce blind spots in feedback loops, and assess mental models that shape organizational behavior. Mastery of these systems thinking elements helps professionals at all levels approach complexity with clarity, foresee consequences, and create strategies that endure.
When Systems Thinking enters daily practice, patchwork solutions make way for durable and scalable improvements. Over time, it leads to effective decisions that drive enterprise-wide agility, greater strategic consistency, and more reliable and resilient performance.
Download free weekly presentations
Enter your email address to download and customize presentations for free
Not for commercial use
Download 'Systems Thinking' presentation — 22 slides
+39 more presentations per quarter
that's $3 per presentation
/ Quarterly
Commercial use allowed. View other plans
To see the whole system, start with its boundaries. The system boundary map reframes teams, tools, and inputs as layered elements that shape outcomes in subtle but significant ways. It separates what exists within the system from what surrounds it, including nearby influencers and more distant external forces. This structure clarifies where authority ends, where dependencies begin, and where constraints sit. Many inefficiencies or bottlenecks arise not from isolated team errors, but from assumptions about ownership or control.
The system purpose statement introduces intent versus outcome. Rather than asking what a system claims to achieve, it reveals what the system consistently produces in practice. This distinction surfaces misalignment between organizational goals and actual performance patterns. The purpose statement also reflects who gains the most from the current setup and which behaviors receive implicit reinforcement. Answers to these questions expose whether performance incentives support strategic aims or undermine them.
Understanding interrelationships requires a shift from looking at isolated actions to tracing how effects move across a system. The causal loop diagram introduces this shift as it maps two types of feedback: reinforcing and balancing.
This structure explains why some initiatives gain traction early but lose momentum later. It also reveals when resistance builds quietly, despite more input or better execution. As the causal loop identifies both the drivers and the counterforces, it provides a clearer picture of what sustains progress and what prevents it from scaling.
The stock and flow diagram builds on this with differentiation between accumulations and movement. Stocks represent stored capacity or resources, while flows determine the rates at which those stocks rise or fall. This distinction highlights where performance stalls due to delayed build-up or uneven release. A team might possess deep product knowledge but see limited innovation due to disconnected handoffs or slow integration. The separation of quantity from timing supports more accurate diagnoses. It also avoids false assumptions about resource sufficiency as it points out where friction exists in the delivery path.
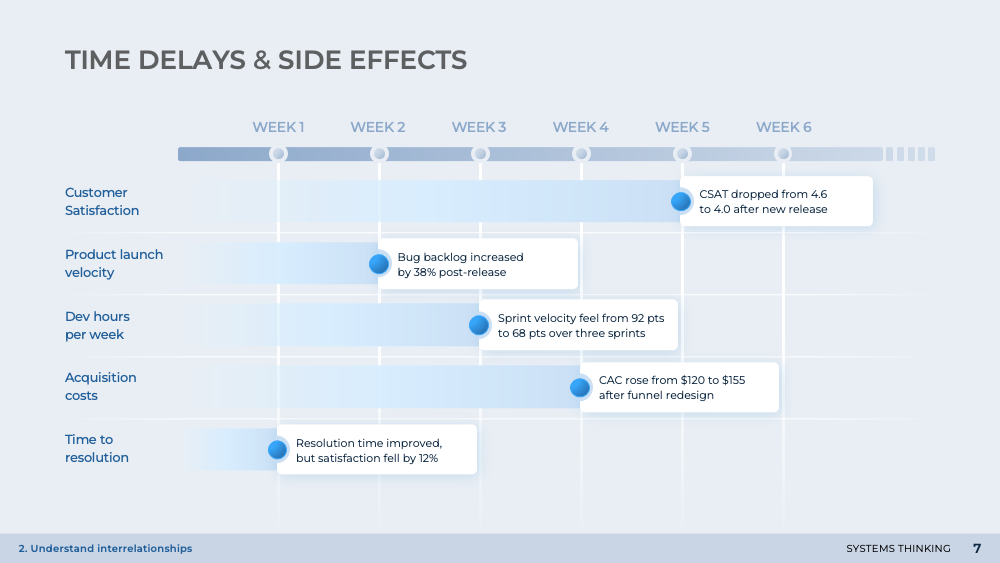
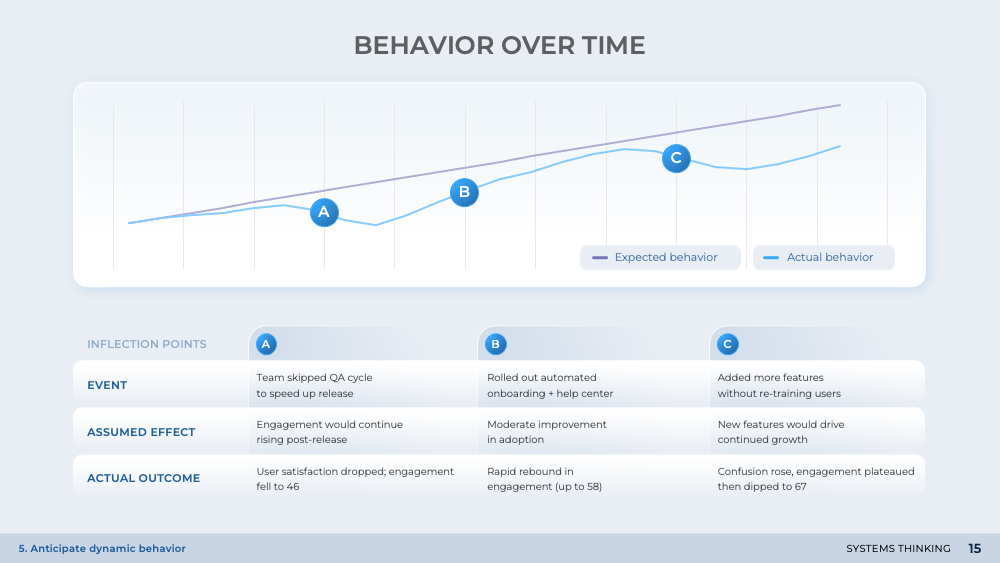
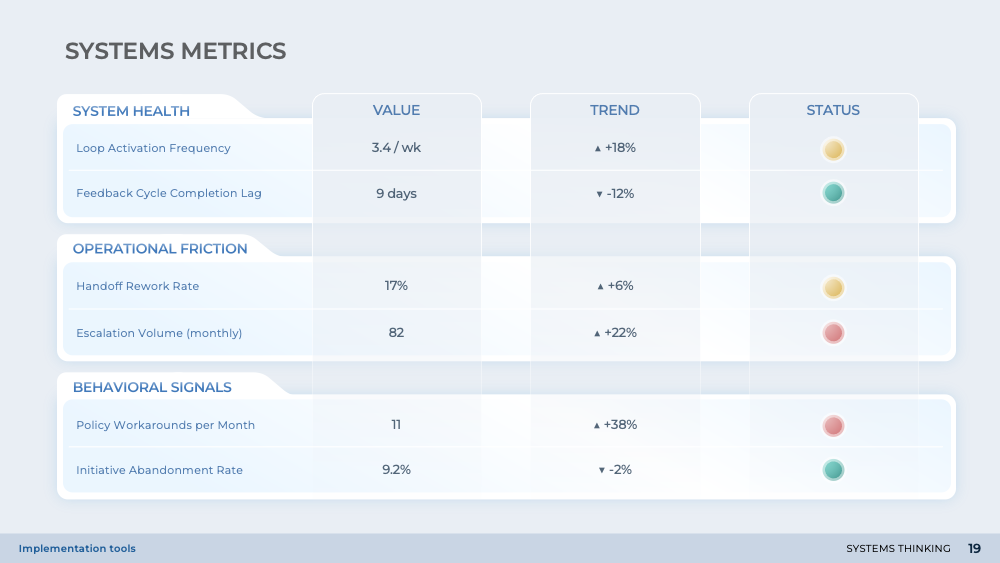
Analyses of time delays and side effects ground these abstractions in real operational signals. The chart tracks how decisions affect different variables over time and exposes consequences that appear only after a delay. A quick win in one metric might precede a longer-term drop in satisfaction or an unexpected spike in cost.
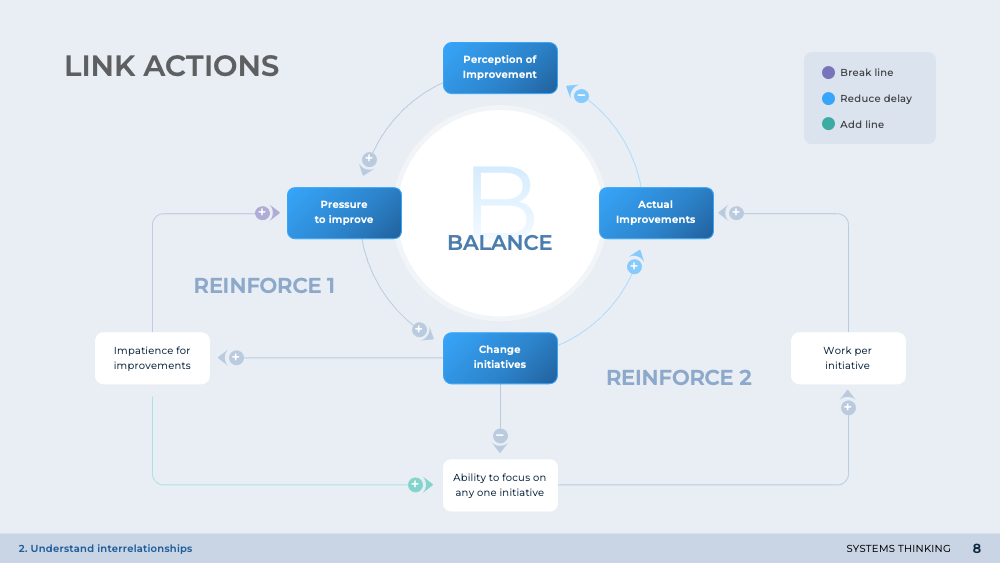
What appears as simple cause and effect in day-to-day operations often hides a looped structure in which actions feed back into the system and alter future states. The reinforcing and balancing loop diagram illustrates how momentum builds or resists within a system. Reinforcing loops create exponential patterns that accelerate outcomes, while balancing loops impose limits that restore stability. The value lies in tracing circular causality rather than linear chains. Teams gain the ability to distinguish between genuine progress that sustains itself and illusions of growth that collapse under hidden strain.
The loop impact over time chart shares a more temporal view. Instead of treating feedback as abstract arrows, it plots how the impact unfolds across weeks or months. A decision to automate may show benefits only after a lag, while side effects surface later in ways that obscure the original intent. This temporal framing prevents overconfidence in early results and sharpens attention on lagging indicators.
Unspoken assumptions often guide strategic choices more than formal analysis. As a result, organizations risk anchoring key initiatives on unverified convictions. Assumptions mapping captures those beliefs under categories of desirability, viability, and feasibility. Belief statements are organized into clusters that allow teams to see the difference between aspiration and reality. The framework elevates discussion from instinct to evidence and exposes where a system relies more on hope than proof.
The exercise can be continued with an added dimension of prioritization. The belief statements are sorted into quadrants based on level of evidence and importance. This reduces wasted energy on low-impact debates and focuses attention on the few beliefs that create the highest leverage.
Conflicts in beliefs highlight another barrier. Different groups often hold opposite views about what matters most, with each belief deepened by experience and incentives. Exposing these clashes does not aim to eliminate disagreement altogether but to reframe it. By clarifying where alignment is essential and where autonomy is acceptable, the framework reduces friction and unlocks more harmonious execution.
Organizations often focus on surface-level incidents, but don't examine what lies beneath. So the same issues reappear in new forms. The Iceberg Model uncovers those deeper drivers. By moving from events to patterns, then into structures and mental models, leaders see how visible outcomes often stem from hidden assumptions and systemic arrangements. This hierarchy prevents reactive responses to short-term symptoms and directs attention toward root causes that shape future trajectories.
The systems archetypes diagnostic names recurring patterns that trap organizations in cycles of drift, escalation, or unintended limits. Archetypes highlight dynamics that feel unique but are in fact predictable. Identifying these archetypes helps avoid repeating costly mistakes, while also pointing to leverage points for more sustainable outcomes.
The action planning grid weighs effort against impact. By categorizing initiatives into quick wins, strategic priorities, low-hanging fruits, or items to avoid, more energy can be directed toward interventions that reshape loops with enduring effect. This prevents organizations from confusing visible busyness with true leverage and helps align cross-functional agendas around shared high-value goals.
Intervention leverage points are ranked by areas of influence across parameters, feedback, design, and intent. Simple adjustments to quantitative measures or buffers may offer accessibility, but deeper shifts in information flows, goals, or paradigms deliver disproportionate impact. This hierarchy of intervention clarifies where leaders should apply their influence if they aim to break entrenched cycles rather than simply optimize at the margins.
Risk mapping and tradeoffs close the loop by framing execution choices against multiple criteria. Instead of treating tradeoffs as hidden compromises, the framework makes them explicit and shows how each option balances opportunity with exposure. This supports more transparent decision-making, sharpens resource allocation, and builds alignment across stakeholders who might otherwise argue from different assumptions.
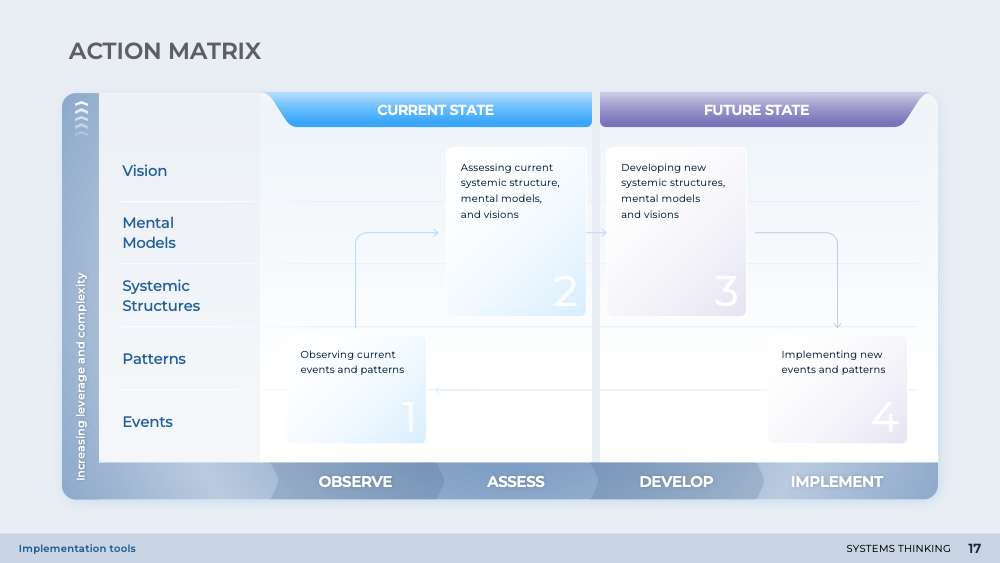
Beyond its diagnostic power, Systems Thinking is a toolkit for foresight, alignment, and execution. As the organization links structure to outcome and intent to impact, it acts with precision rather than haste. The result is durable progress, stronger resilience, and strategic success that compound over time.
Download free weekly presentations
Enter your email address to download and customize presentations for free
Not for commercial use
Download 'Systems Thinking' presentation — 22 slides
+39 more presentations per quarter
that's $3 per presentation
/ Quarterly
Commercial use allowed. View other plans

Feel overwhelmed by a seemingly complex problem? Download the Problem-Solving Frameworks template to deconstruct problems into a series of smaller, logical steps. This deck includes tools that survey and identify a problem, explore potential causes, brainstorm potential counter measures, implement proposals, and then evaluate the outcome.

Does your team struggle to find long-term solutions for persistent problems? Our Root Cause Analysis Toolbox provides proven methods to uncover the deepest-seated causes behind recurring challenges. Use these RCA tools to prevent future issues, improve operational efficiency, and reduce wasted resources.

How can you accelerate the cerebral engines that power those “Aha!” moments? And what sets a good idea apart from just any average idea? Whether it’s as a collaborative effort with other team members, or a solo endeavor at your desk, or thinking on-the-spot during a case interview, or even leading a workshop, use our collection of Brainstorming Techniques to upkeep the mind palace.

Need to simplify workflow management and make it more effective? This Flow Chart collection includes a variety of visualizations that can be used and customized for all kinds of business scenarios, such as PERT flow chart, user journey flow, standard operating procedure, SIPOC flow, root cause analysis, and many more.