Question
The key components of a KPI Dashboard include:
1. Key Performance Indicators (KPIs): These are the metrics that you are tracking. They should be relevant to your business goals and objectives.
2. Data Visualization: This includes charts, graphs, and other visual aids that make it easy to understand the data at a glance.
3. Real-Time Data: The dashboard should be able to update in real time to provide the most accurate information.
4. User-Friendly Interface: The dashboard should be easy to navigate and understand, even for non-technical users.
5. Customizability: Users should be able to customize the dashboard to fit their specific needs, such as by adding or removing KPIs, changing the layout, etc.
6. Integration: The dashboard should be able to integrate with other systems and software used in the business to pull in necessary data.
Remember, the goal of a KPI dashboard is to provide a clear, concise view of performance and progress towards goals.
This question was asked on:
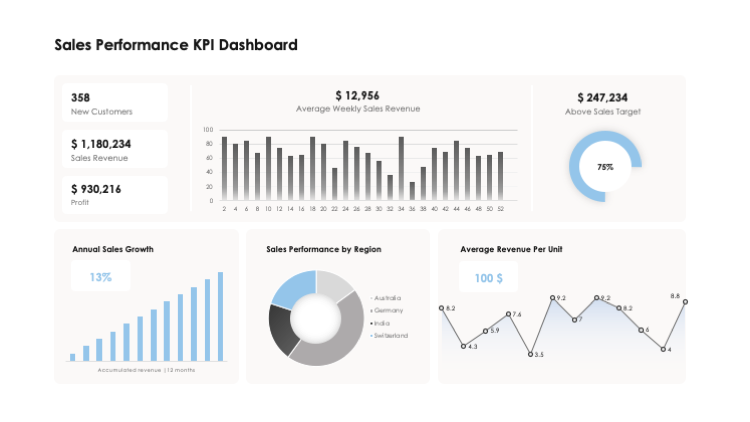
A well-organized KPI dashboard ties all your performance indicators together in one place, so you can easily compare and analyze them. Because these indicators are usually divided into high-level and low-level KPIs, laying them out on a single dashboard helps to monitor the process of smaller goals flowing into bigger ones.


Receive new free presentations every Monday to your inbox.
Full content, complete versions — No credit card required.
