Question
What are the benefits of creating a KPI dashboard and how does it enhance business performance?
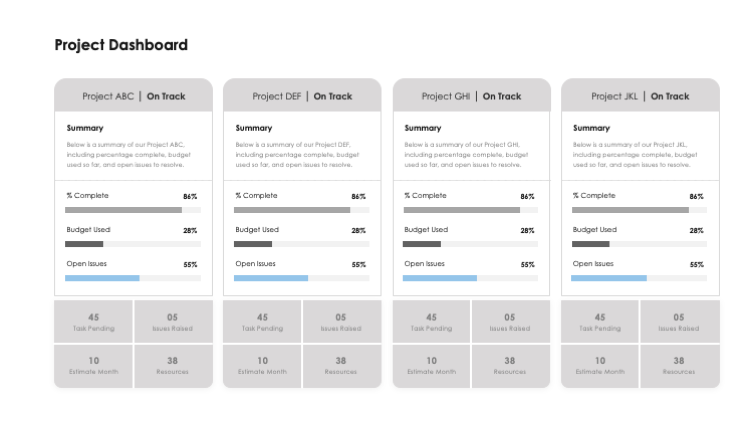
Creating a KPI dashboard has several benefits. It provides a visual representation of performance measures, enabling businesses to understand complex data. It helps in tracking the progress towards organizational goals and facilitates decision-making based on data-driven insights. It also allows for comparison of data over time, across different demographics, channels, and geographic locations. This enhances business performance by enabling timely identification of issues and opportunities, promoting efficiency, and fostering a culture of continuous improvement.
This question was asked on:
Identify the appropriate KPIs – determine which metrics reflect a particular KPI, relevant and important to your venture's general performance. An important thing to remember here, the experts say, is that although every brand might define customer satisfaction as KPI, the metrics available to measure that KPI might differ across brands and organizations. Set up a process (preferably automated) – gather the necessary metrics in one place, because (once again) "analyzing a metric in isolation often doesn't provide all the insights you find when comparing metrics against each other," the experts say. Visualize – visualization is essential for gaining insights that drive decision-making. The experts argue that tables of data aren't as powerful as visuals. Consider presenting performance over time, and separating it by key divisions: by channel, by demographic, by geographic location, etc. Create a dashboard – build a KPI dashboard containing your visualizations and connect it to the raw d...
Asked on

Preview (35 Slides)


Join for free.
Get new presentations each week.
Receive new free presentations every Monday to your inbox.
Full content, complete versions — No credit card required.