resource preview
resource preview
resource preview
resource preview
resource preview
resource preview
resource preview
resource preview
resource preview
resource preview
resource preview
resource preview
resource preview
resource preview
resource preview
resource preview
resource preview
resource preview
resource preview
resource preview
resource preview
resource preview
resource preview
resource preview
resource preview
resource preview
resource preview
resource preview
resource preview
resource preview
resource preview
resource preview
resource preview
resource preview
resource preview
resource preview
chevron_right
chevron_left
download Download this presentation

Download and customize 500+ business templates and translate PowerPoints

Go to dashboard to download stunning resources

Download

Preview

View all chevron_right

Synopsis

One metric analysis on its own doesn't offer as many insights as when several metrics are measured against each other, according to Mckinsey & Co and other experts. With our KPI Dashboards (Part 1) and KPI Dashboards (Part 2), you can have all your key performance indicators – from financial to marketing and project management – in one place, to keep track of, meet and exceed all your company goals.
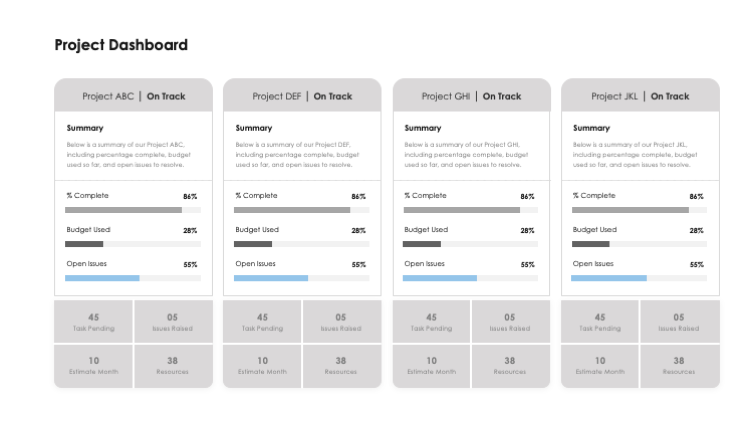
stars icon
Questions and answers
info icon

KPI Dashboards have several practical applications in the marketing industry. They provide a visual representation of key performance indicators (KPIs) that help in tracking and measuring the effectiveness of marketing strategies. They can be used to monitor metrics like customer acquisition cost, customer lifetime value, conversion rates, and more. This allows marketers to identify trends, make data-driven decisions, and improve their marketing efforts. Furthermore, KPI Dashboards can help in aligning marketing goals with the overall business objectives, ensuring that the marketing team is working towards the same targets as the rest of the company.

KPI Dashboards align with digital transformation initiatives by providing a centralized platform for tracking, analyzing, and visualizing key performance indicators. This enables businesses to make data-driven decisions, improve efficiency, and achieve their goals. Digital transformation is all about leveraging technology to enhance business operations, and KPI Dashboards are a crucial part of this process as they provide real-time insights into business performance.

View all questions
stars icon Ask follow up
download Download this presentation

Download and customize 500+ business templates and translate PowerPoints

Go to dashboard to download stunning resources

Download

Slide highlights

Use this slide to communicate the analysis of your Social Media KPIs to your team and/or stakeholders. These include impressions, conversion rate, Click-Through Rate (CTR), Cost Per Thousand Impressions (CPM) and other indicators.

resource image

With this slide, share your Advertising Media KPIs data analysis. These include Return on Ad Spend (ROAS), Cost Per Acquisition, Cost Per Action, Customer, Acquisition Cost (CAC), Website Conversions and other indicators.

resource image

Slides such as this one are great for introducing your profitability KPIs. These include Average Revenue Per User (ARPU), Cost of Goods and Services Sold (COGS), Gross Profitability, Client Contribution (CC) and other indicators.

resource image
stars icon
Questions and answers
info icon

Average Revenue Per User (ARPU) is a key metric in understanding a company's profitability. It measures the revenue generated per user or unit. Gross Profitability, on the other hand, is the profit a company makes after deducting the costs associated with making and selling its products, or the costs associated with providing its services.

ARPU contributes to Gross Profitability as it directly impacts the revenue part of the equation. A higher ARPU means that each user or unit is generating more revenue, which can lead to increased gross profits assuming costs remain constant. Therefore, strategies aimed at increasing ARPU can have a positive effect on a company's Gross Profitability.

The Cost Per Acquisition (CPA) and Return on Ad Spend (ROAS) are closely related. CPA is the amount of money spent to acquire a new customer. ROAS, on the other hand, is the revenue generated from each dollar spent on advertising. If the CPA is high, it means you're spending a lot to acquire each customer, which could lower your ROAS. Conversely, if your CPA is low, you're spending less to acquire each customer, which could result in a higher ROAS. Therefore, effectively managing and reducing CPA can lead to an increase in ROAS.

View all questions
stars icon Ask follow up
resource image

Application

Business 2 Communityoffers this step-by-step guide for effective KPIs monitoring:

  1. Identify the appropriate KPIs – determine which metrics reflect a particular KPI, relevant and important to your venture's general performance. An important thing to remember here, the experts say, is that although every brand might define customer satisfaction as KPI, the metrics available to measure that KPI might differ across brands and organizations.
  2. Set up a process (preferably automated) – gather the necessary metrics in one place, because (once again) "analyzing a metric in isolation often doesn't provide all the insights you find when comparing metrics against each other," the experts say.
  3. Visualize – visualization is essential for gaining insights that drive decision-making. The experts argue that tables of data aren't as powerful as visuals. Consider presenting performance over time, and separating it by key divisions: by channel, by demographic, by geographic location, etc.
  4. Create a dashboard – build a KPI dashboard containing your visualizations and connect it to the raw data so the decision-makers can divide the data as needed.
  5. Make decisions – based on the metrics and KPIs produced, create an Action Plan and a roadmap for meeting and improving your KPIs.
stars icon
Questions and answers
info icon

Customer satisfaction plays a crucial role as a Key Performance Indicator (KPI) in different businesses. It serves as a metric that helps businesses understand how well they are meeting the expectations of their customers. High levels of customer satisfaction indicate that a business is successfully fulfilling its customers' needs, which can lead to repeat purchases and customer loyalty. On the other hand, low customer satisfaction can be a warning sign of potential issues, such as poor product quality or inadequate customer service, which could negatively impact the business's reputation and bottom line. However, the specific metrics used to measure customer satisfaction may vary across different businesses and industries.

The metrics used to measure a particular KPI might differ across brands and organizations due to several reasons. Firstly, different brands and organizations have different goals and objectives, hence the need for different metrics to measure their performance. Secondly, the nature of the industry or market in which a brand operates can influence the type of metrics used. For instance, a tech company might focus on user engagement metrics while a retail company might focus on sales metrics. Lastly, the availability and accessibility of data can also determine the metrics used. Some organizations might have access to certain types of data that others do not, leading to the use of different metrics.

View all questions
stars icon Ask follow up
resource image
resource image

Expert advice

In his article for Harvard Business Review (HBR), Gene Cornfield, a Global Lead for the High-Tech Industry at Accenture Interactive, discusses important KPIs that you should but probably aren't tracking yet.

First, Cornfield poses a question: "Most leaders say they're customer-centric, but if everything they measure is company-centric, how could that be true?" He then goes on to explain that Customer Performance Indicators (CPIs) is "the new black" in the world of KPIs. In a nutshell, CPIs are the metrics that customers value, rather than the ones that the company values the most. For example, how fast someone can get a pricing quote, a "first-time resolution" on a customer service call or having a grocery delivery with "nothing broken."

stars icon
Questions and answers
info icon

Integrating Customer Performance Indicators (CPIs) into a company's KPI Dashboard can provide several benefits. Firstly, it can help the company to become more customer-centric by focusing on metrics that customers value, rather than just the ones that the company values. This can lead to improved customer satisfaction and loyalty. Secondly, it can provide more detailed and relevant insights into customer behavior and preferences, which can inform strategic decision-making and drive business growth. Lastly, it can help to identify areas for improvement in the customer journey, leading to enhanced customer experiences and outcomes.

Customer Performance Indicators (CPIs) can be utilized in different industries by focusing on the metrics that customers value the most. For instance, in the retail industry, a CPI could be the speed of delivery or the quality of products upon arrival. In the service industry, it could be the efficiency of resolving customer issues. In the tech industry, it could be the user-friendliness of a software or app. Essentially, CPIs should be tailored to meet the specific needs and expectations of customers in each industry.

View all questions
stars icon Ask follow up

To master this metric, Cornfield writes, first, separate CPIs from KPIs. Thus, many assume that is a CPI. But actually, only businesses really care about their NPS; customers typically don't, he explains. Next, define your CPIs. Look for ways to uncover "customer frustrations, expectations and target outcomes at specific points of their customer journeys, and then ask the series of open-ended questions to gain insights that surveys wouldn't know to ask, and that customers might not be inclined to answer in a survey," Cornfield writes. Finally, drive business performance by connecting CPIs to KPIs. Once CPIs are determined, measure them and see how they impact one or more of your KPIs. When the relationships between specific CPIs and KPIs are confirmed, start holding teams accountable to CPIs they can impact, Cornfield writes.

stars icon
Questions and answers
info icon

Understanding the relationship between specific Customer Performance Indicators (CPIs) and Key Performance Indicators (KPIs) is crucial for driving business performance. Once CPIs are determined, measuring them and seeing how they impact one or more of your KPIs can provide valuable insights. When the relationships between specific CPIs and KPIs are confirmed, teams can be held accountable to CPIs they can impact. This can help uncover customer frustrations, expectations, and target outcomes at specific points of their customer journeys, leading to improved customer satisfaction and business performance.

Teams can be held accountable to CPIs they can impact by first defining the CPIs and understanding how they relate to the customer's journey. Once these CPIs are determined, they should be measured to see how they impact the KPIs. When the relationships between specific CPIs and KPIs are confirmed, teams can then be held accountable for the CPIs they can influence. This process ensures that teams are focused on areas they can control and improve, thereby driving business performance.

View all questions
stars icon Ask follow up
download Download this presentation

Download and customize 500+ business templates and translate PowerPoints

Go to dashboard to download stunning resources

Download