When creating a KPI dashboard, consider the following key elements:
1. Simplicity: Keep your dashboard to a single screen for a quick and concise survey of business performance and potential threats.
2. Relevance: Only include the most critical, insightful KPIs. This will force you and your team to focus on the most important information about the venture's performance.
3. User-friendly: Make the dashboard easy to navigate and understand. Arrange the data strategically, aesthetically, and logically.
4. Clarity: Concentrate on information delivery and comprehension. Avoid intricate designs and unnecessary variety.
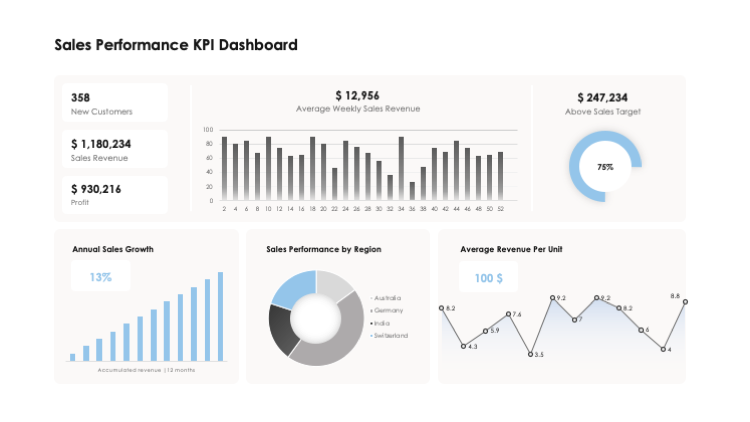
This question was asked on the following presentation:

Establish, communicate, and measure your goals with our KPI Dashboards collection. From financial performance, to sales, to project management, this d...
Go to dashboard to download stunning resources
Download


Text this question was asked on:
Keep your dashboard to a single screen – the goal of creating a KPI dashboard is to get a quick and concise survey of the business performance and potential threats. Only include the most critical, insightful KPIs – this will force you and your team to really focus on the most important information about the venture's performance. Make the dashboard easy to navigate and understand – don't dump as much information onto one page as you possibly can and make sure to arrange the data strategically, aesthetically and logically. Concentrate on information delivery and comprehension – don't use intricate designs and don't introduce variety that doesn't provide much value, the experts recommend.