High-level KPIs are the overall goals and objectives of the organization, often tied to its strategic initiatives. They provide a big picture view of the company's performance. On the other hand, low-level KPIs are more operational and tactical, focusing on individual processes or tasks within departments. They help in monitoring the progress of smaller goals that contribute to the achievement of high-level KPIs.

This question was asked on the following presentation:

resource preview

KPI Dashboards (Part 1)

Establish, communicate, and measure your goals with our KPI Dashboards collection. From financial performance, to sales, to project management, this d...

download Download this presentation

Download and customize 500+ business templates and translate PowerPoints

Go to dashboard to download stunning resources

Download

presentation Preview

View all chevron_right

Text this question was asked on:

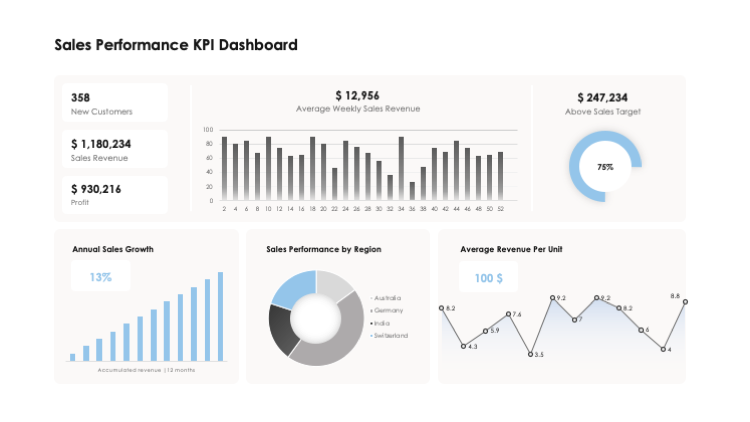
A well-organized KPI dashboard ties all your performance indicators together in one place, so you can easily compare and analyze them. Because these indicators are usually divided into high-level and low-level KPIs, laying them out on a single dashboard helps to monitor the process of smaller goals flowing into bigger ones.

stars icon
Questions and answers
info icon

KPI dashboards enhance business strategy and goal setting by providing a centralized platform for tracking and analyzing performance indicators. They allow for easy comparison and analysis of high-level and low-level KPIs. This helps in monitoring the process of smaller goals flowing into bigger ones, thereby facilitating strategic planning and goal setting. They also aid in communicating the progress towards goals across various departments and functions, fostering transparency and alignment within the organization.

The key components of a KPI dashboard include high-level and low-level KPIs. High-level KPIs focus on the overall performance of the business while low-level KPIs focus on processes in departments such as sales, marketing, HR, support and others. The dashboard ties all these indicators together in one place for easy comparison and analysis. It helps in monitoring the process of smaller goals flowing into bigger ones.

View all questions
stars icon Ask another question