Question
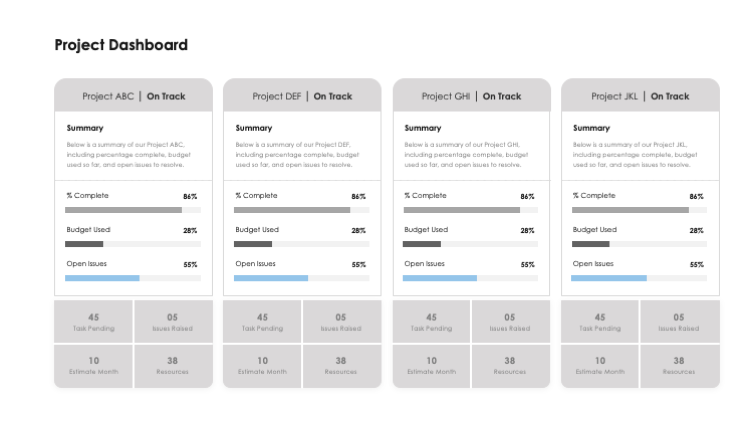
The KPI Dashboards collection from Mckinsey & Co is unique because it allows for a comprehensive view of various key performance indicators (KPIs) in one place. This includes financial, marketing, and project management KPIs. The ability to measure multiple metrics against each other provides deeper insights than analyzing one metric in isolation. This comprehensive and comparative approach helps in tracking, meeting, and exceeding company goals more effectively.
This question was asked on:
One metric analysis on its own doesn't offer as many insights as when several metrics are measured against each other, according to Mckinsey & Co and other experts. With our and , you can have all your key performance indicators – from financial to marketing and project management – in one place, to keep track of, meet and exceed all your company goals.


Receive new free presentations every Monday to your inbox.
Full content, complete versions — No credit card required.
