
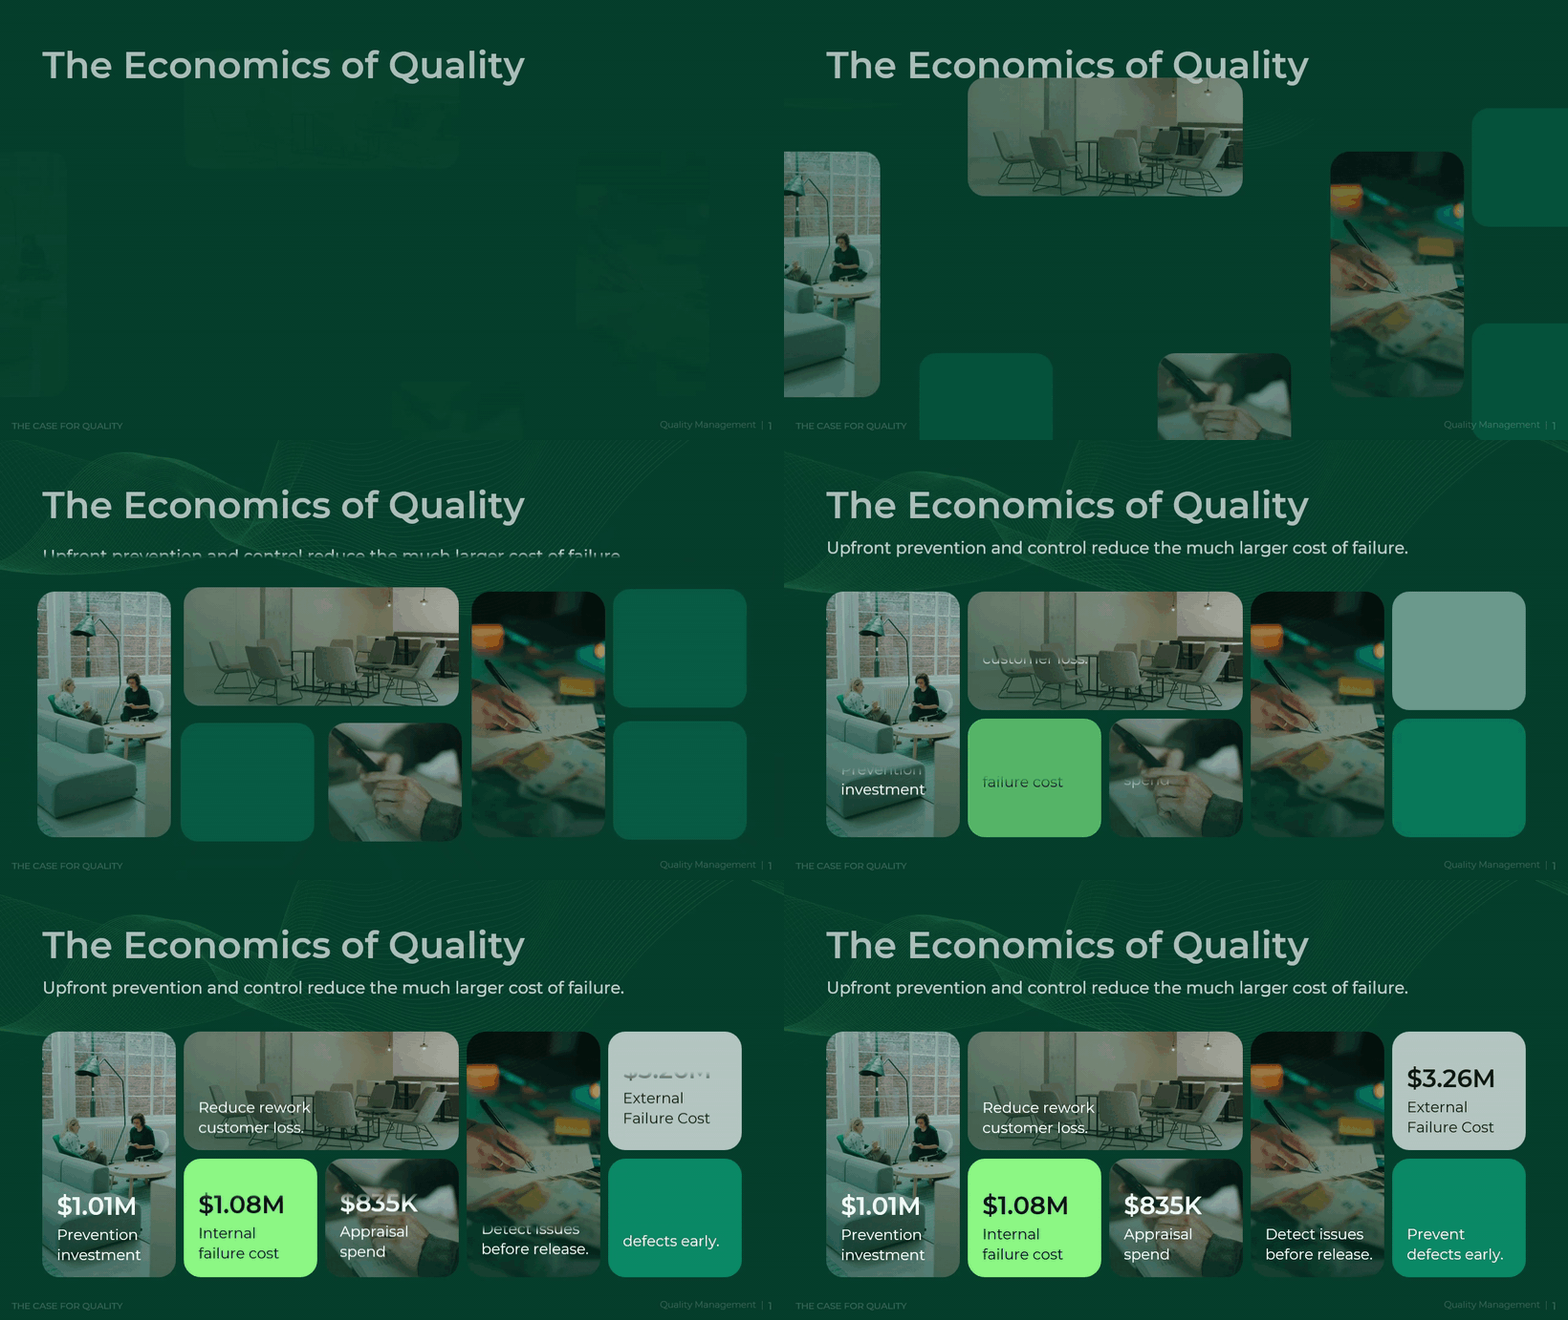
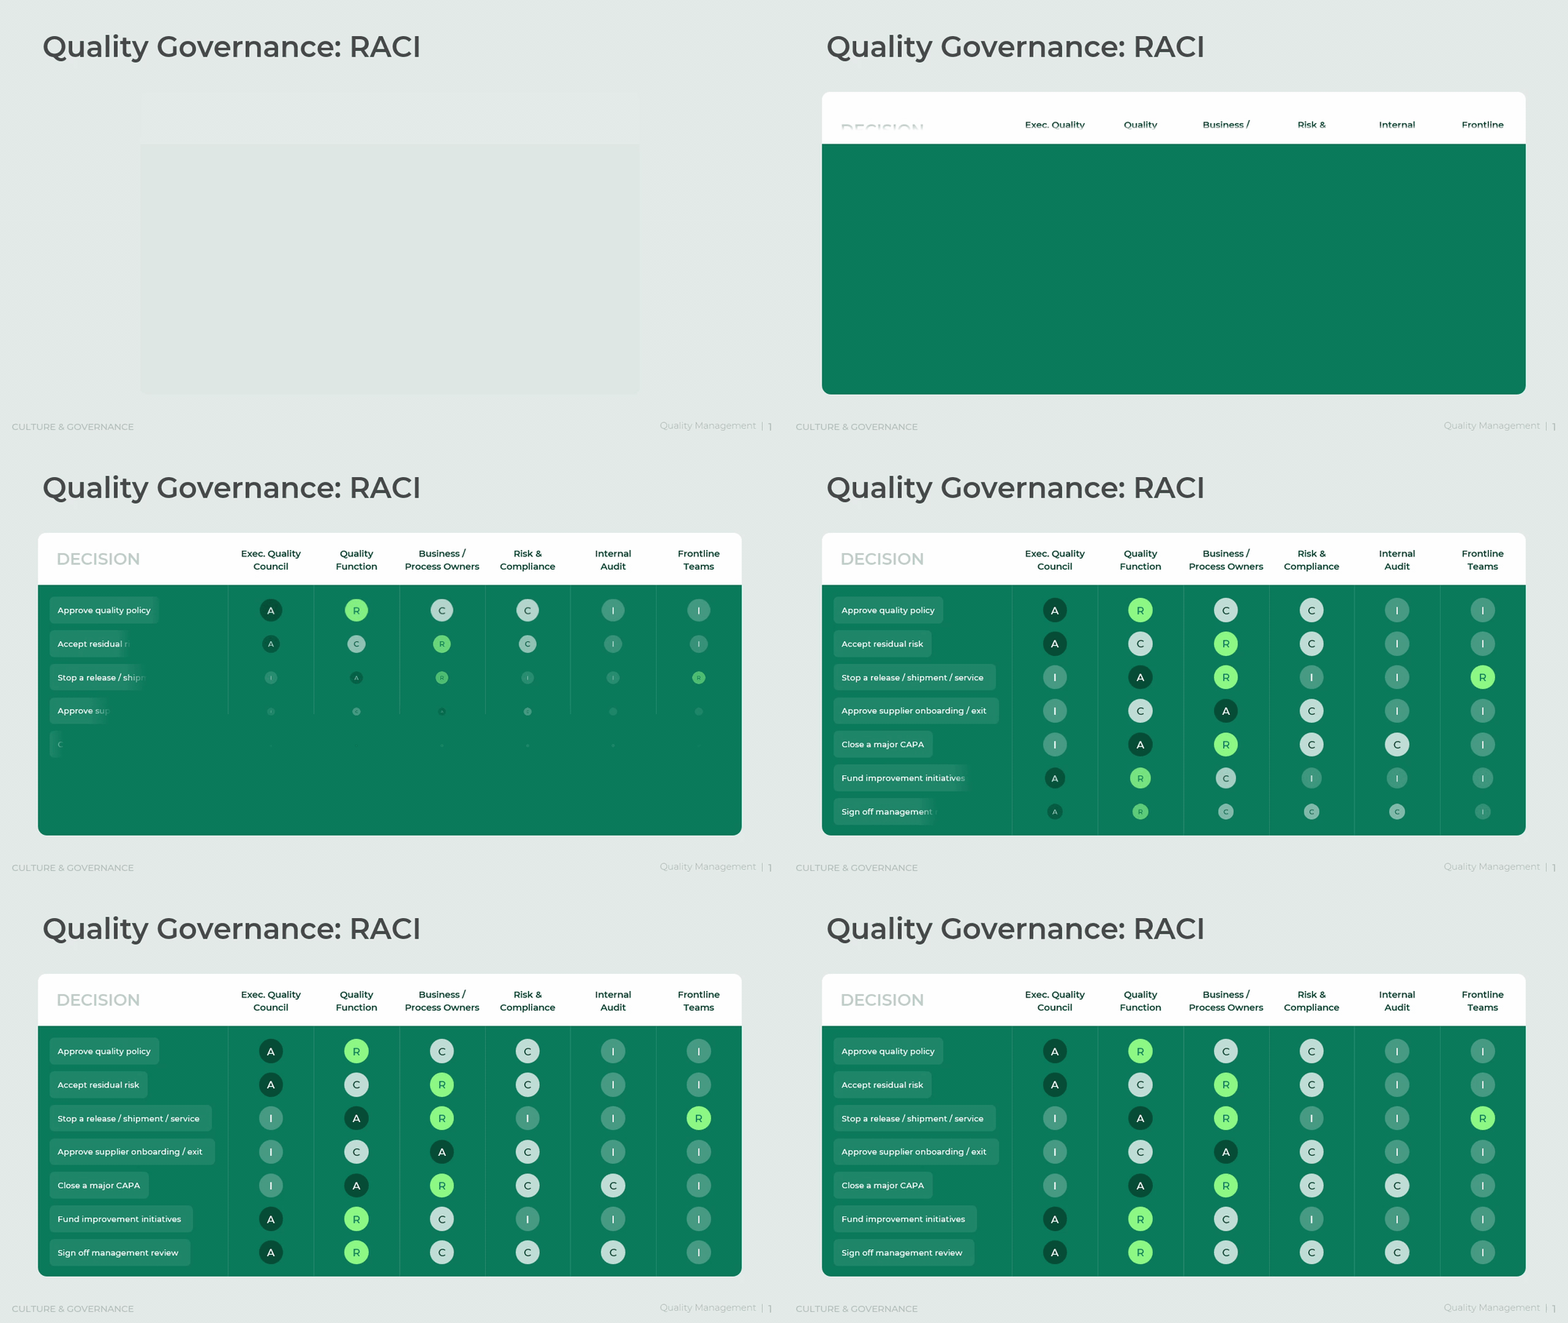











Quality carries a direct cost. The American Society for Quality estimates that the cost of poor quality reaches 15% to 20% of sales revenue at many organizations. Most of that spend hides in external failure, the defects customers find first. A structured quality system shifts money away from failure and toward prevention, where each dollar returns far more.
Translate Customer Voice into Measurable Requirements
Quality starts with a clear definition of what the customer actually needs. Many teams guess at requirements or copy them from old specifications. The result is a product that meets internal targets but disappoints the market. This framework begins with the Voice of the Customer and converts each complaint into a Critical-to-Quality (CTQ) requirement. Vague expectations become measurable targets with named owners.
Customer requirements carry direct financial weight. Research by Fred Reichheld, published through Bain & Company and the Harvard Business Review, found that a 5% rise in customer retention can lift profits by 25% to 95%. A single unmet requirement, such as a sensor that drifts out of calibration early, can end a contract. When needs are defined with precision, retention and revenue both hold.
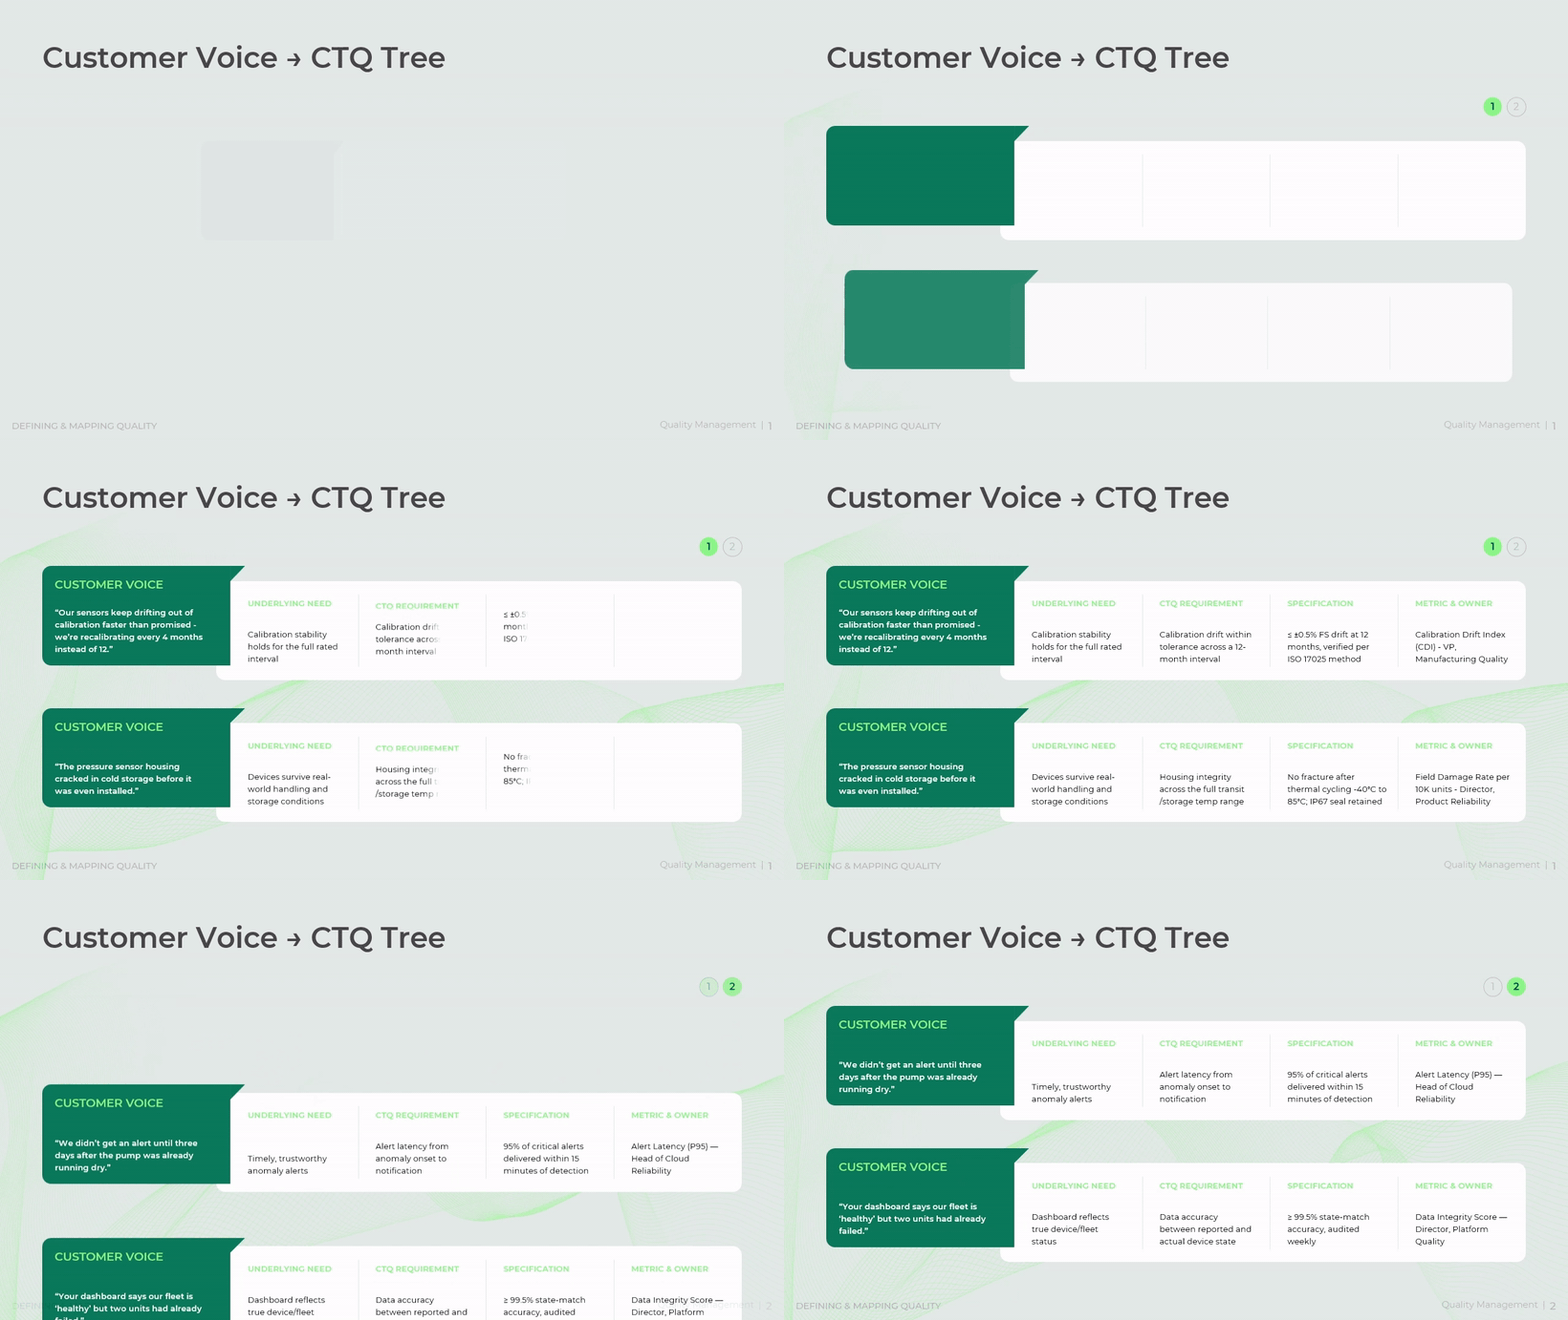
The CTQ Tree moves across five columns. It starts with a direct customer quote, then names the underlying need, the CTQ requirement, the exact specification, and the metric with its owner. One row turns the complaint "our sensors keep drifting out of calibration" into a specification of "0.5% full-scale drift or less at 12 months, verified per ISO 17025," owned by the VP of Manufacturing Quality. Other rows cover housing fractures, alert latency, and dashboard accuracy. Managers replace the sample quotes with real customer language, then assign each requirement a measurable limit and a single accountable owner.
Build a Culture That Owns Quality
Tools alone do not create quality. Behavior does. A framework can define perfect controls, and teams can still cut corners under deadline pressure. This section builds a quality culture that holds even when no one checks. It names the specific behaviors, rights, and habits that place quality ahead of short-term output.
Consider a mid-size manufacturer whose operations review always opens with revenue and closes with quality, if time allows. Defect reports arrive late, and the same failures repeat. A competitor opens every review with quality metrics first and grants any employee the right to pause work. Within a year, the second plant reports fewer escapes and lower warranty cost. The difference is culture, not equipment.
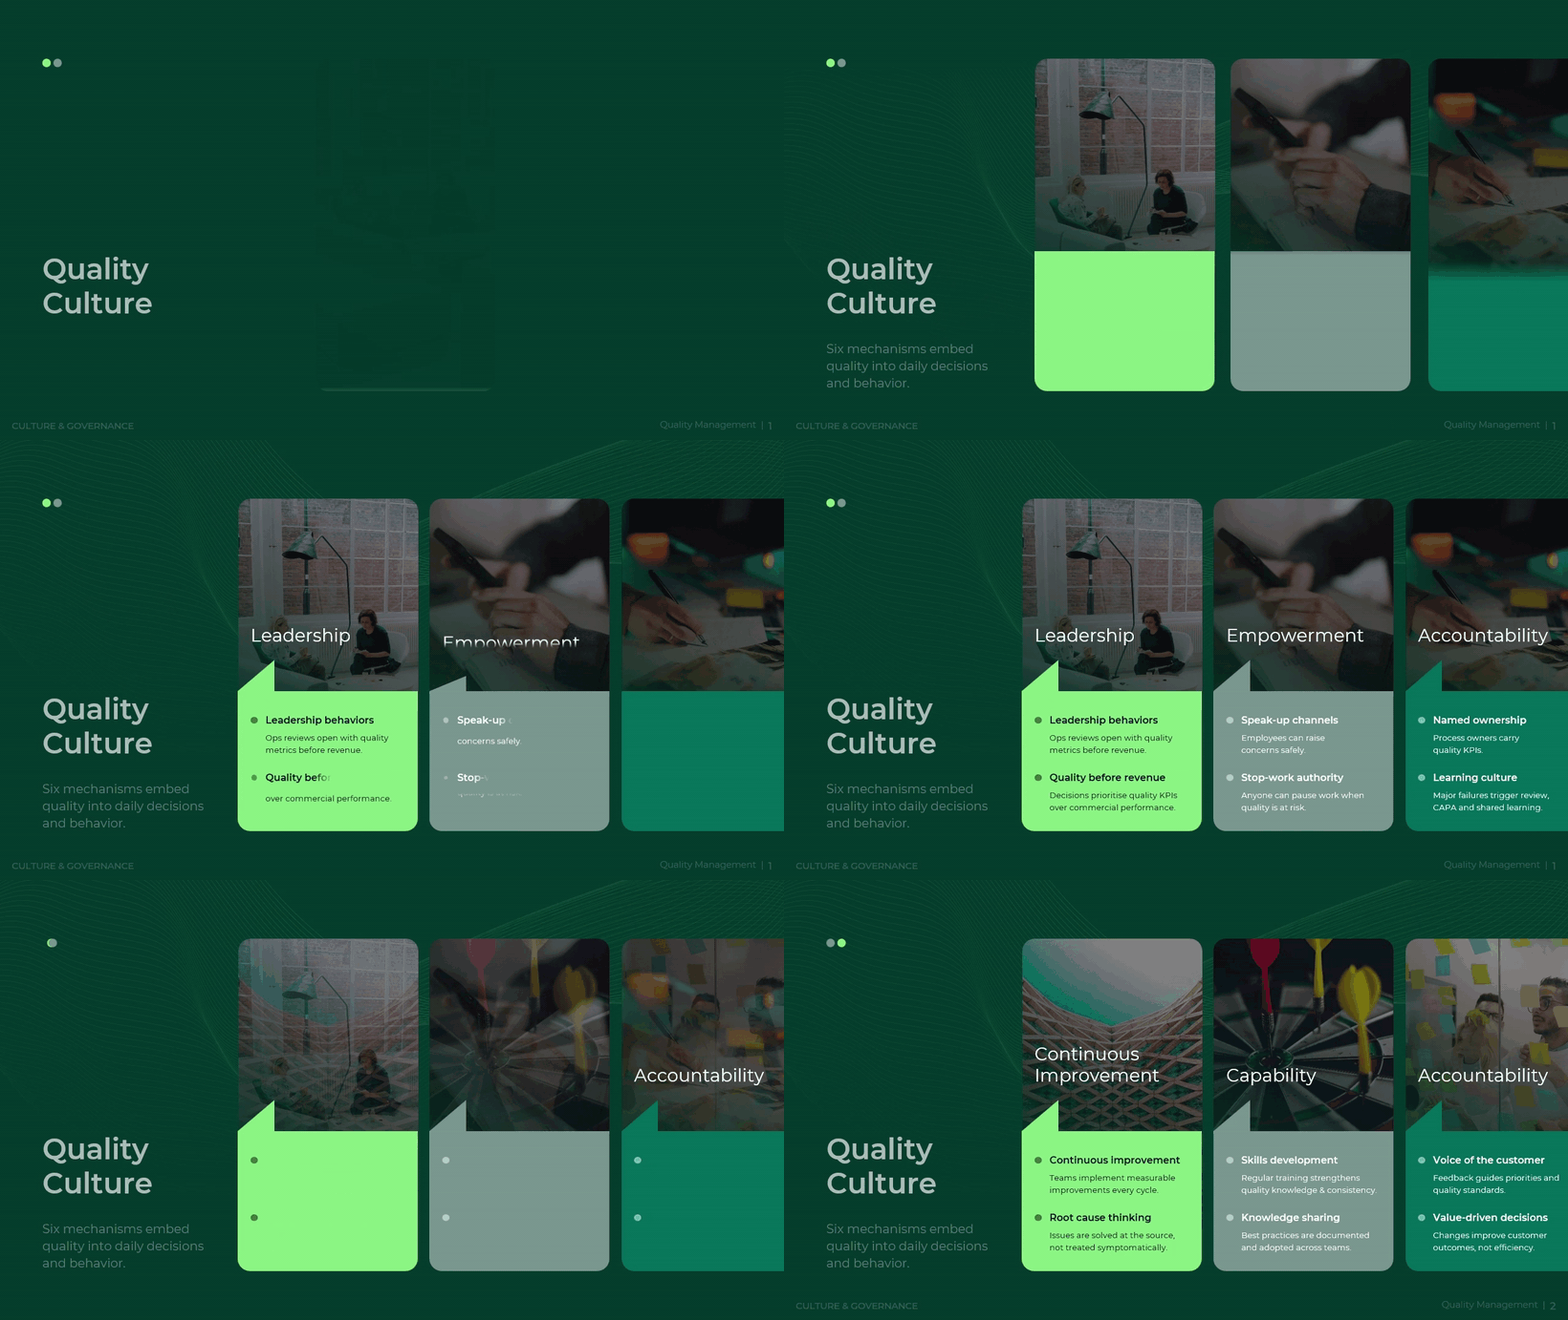
This framework defines twelve mechanisms that embed quality into daily decisions, six per view. The first set covers leadership behaviors, speak-up channels, named ownership, quality before revenue, stop-work authority, and a learning culture. The second set covers continuous improvement, skills development, voice of the customer, root-cause thinking, knowledge sharing, and value-driven decisions. Each mechanism pairs a principle with a concrete practice. "Stop-work authority" means anyone can pause work when quality is at risk. "Quality before revenue" means ops reviews open with quality metrics. Managers audit their organization against each mechanism, then close the gaps where practice falls short of the principle.
Download presentation

Quality Management
PowerPoint
18 Slides
To continue, enter your email:
Find and Rank the Real Causes of Failure
When a failure reaches the customer, the first question is why. Teams often fix the symptom and move on, so the fault returns. This framework separates cause from symptom with two proven methods. It finds the true root cause, then ranks every failure mode by risk, so effort goes where exposure is highest.
Both methods have deep industrial roots. The 5 Whys technique was developed by Taiichi Ohno within the Toyota Production System. Failure Mode and Effects Analysis (FMEA) is standardized across the automotive industry through the AIAG and VDA handbook and sits inside ISO 9001 quality systems. The Risk Priority Number, calculated as Severity times Occurrence times Detection, gives teams a shared score to compare risks that would otherwise feel equal.
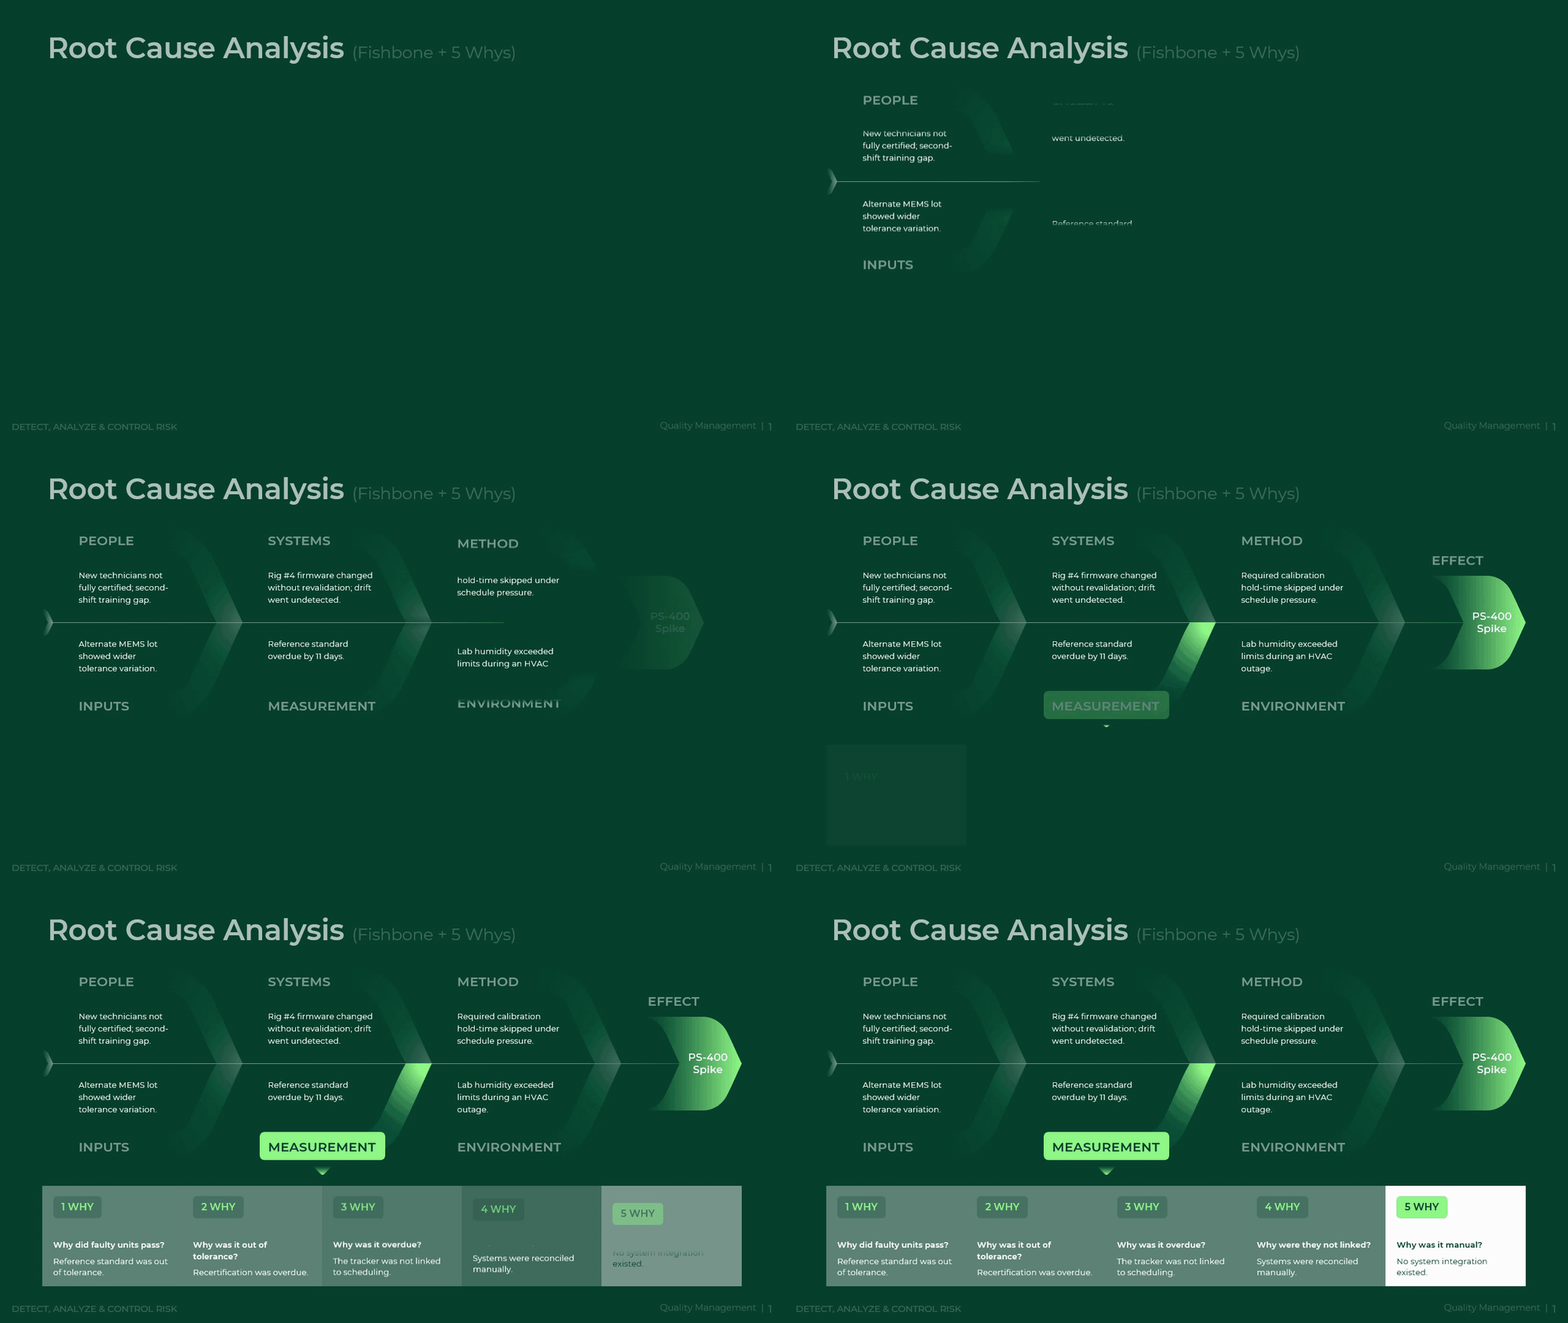
Root Cause Analysis combines a Fishbone diagram with a 5 Whys chain. The Fishbone sorts possible causes into six branches: People, Systems, Method, Measurement, Inputs, and Environment. The 5 Whys then drills down one question at a time. In the sample case, faulty units passed because the reference standard was out of tolerance, which happened because recertification was overdue, which traced back to a tracker that was never linked to scheduling. Managers use this method when a defect needs a documented cause, not a guess.
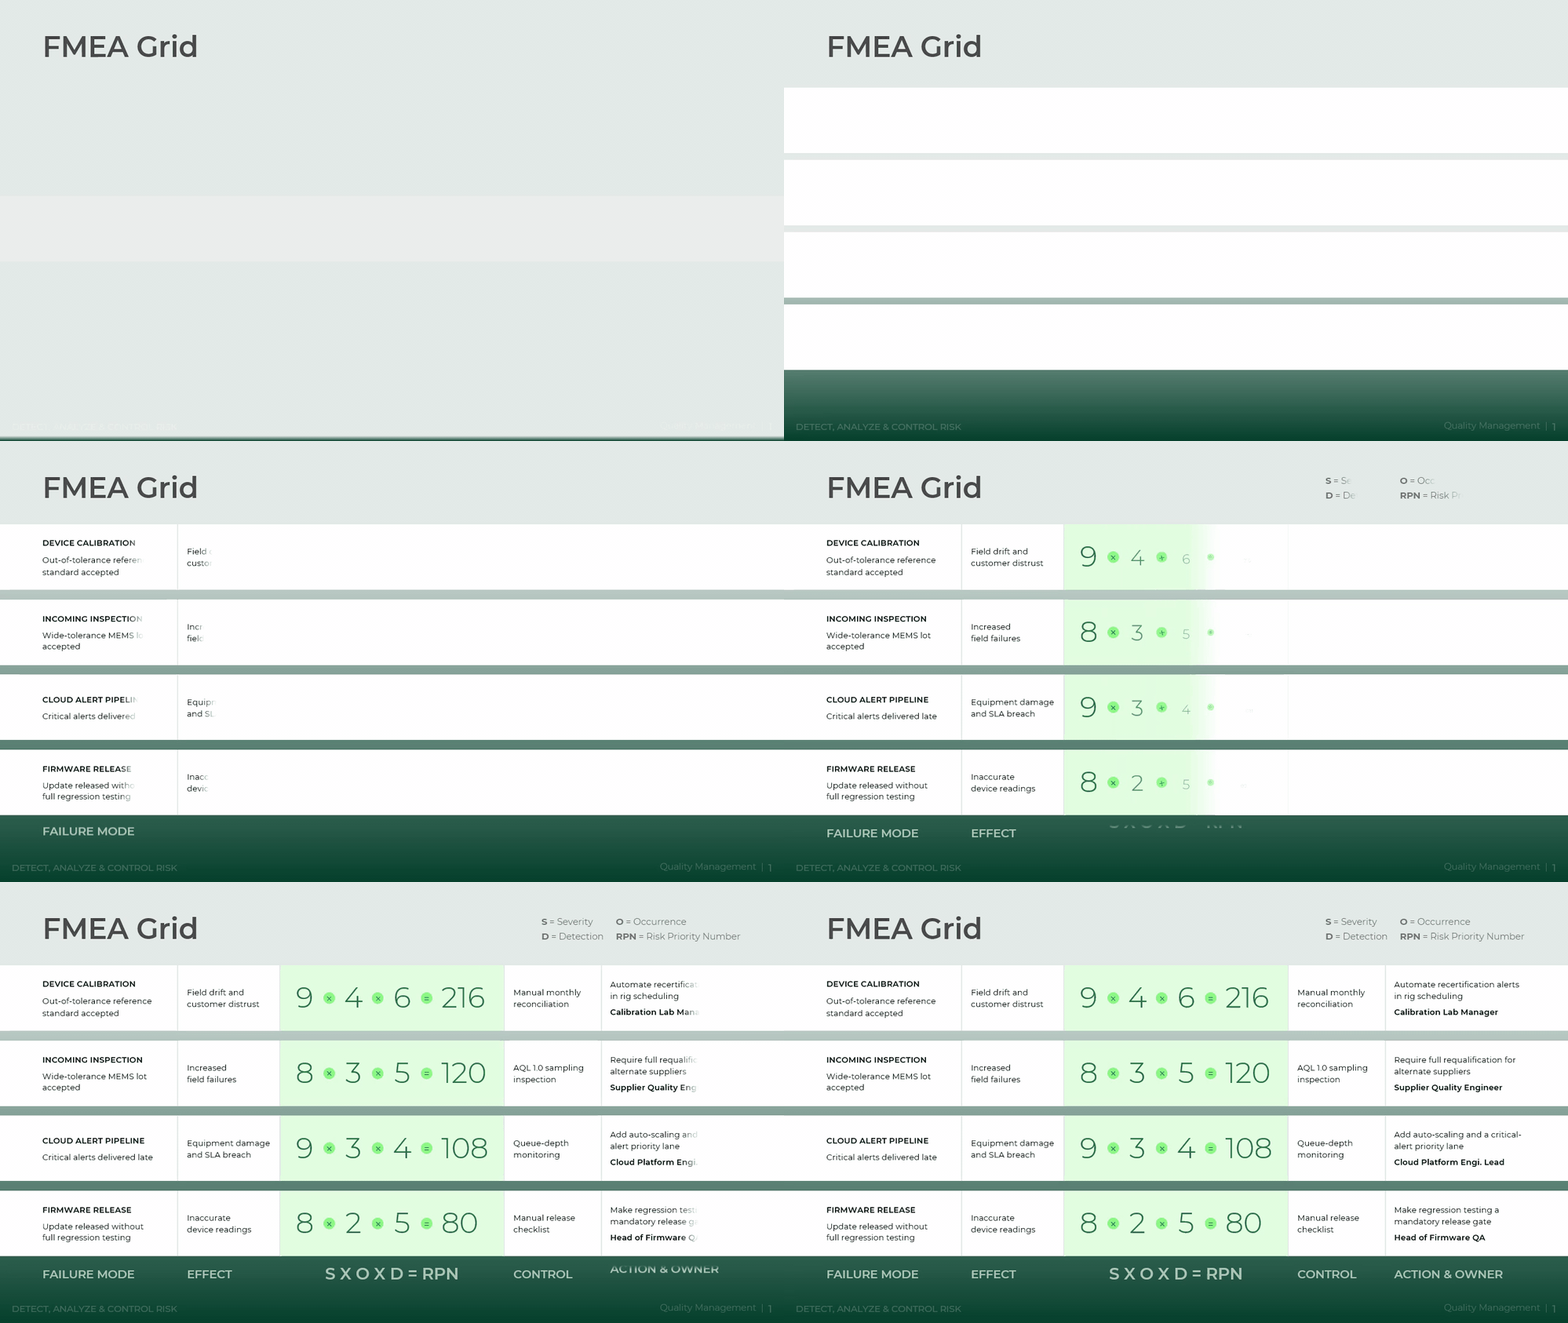
The FMEA Grid turns those causes into ranked risk. Each row lists a failure mode, its effect, the current control, and the planned action with an owner. Three scores, Severity, Occurrence, and Detection, multiply into the Risk Priority Number. In the sample grid, an out-of-tolerance reference standard scores 216 and rises to the top, well above a late firmware release at 80. Managers score each row honestly, sort by RPN, and assign the highest numbers first.
Lock In Preventive and Detective Controls
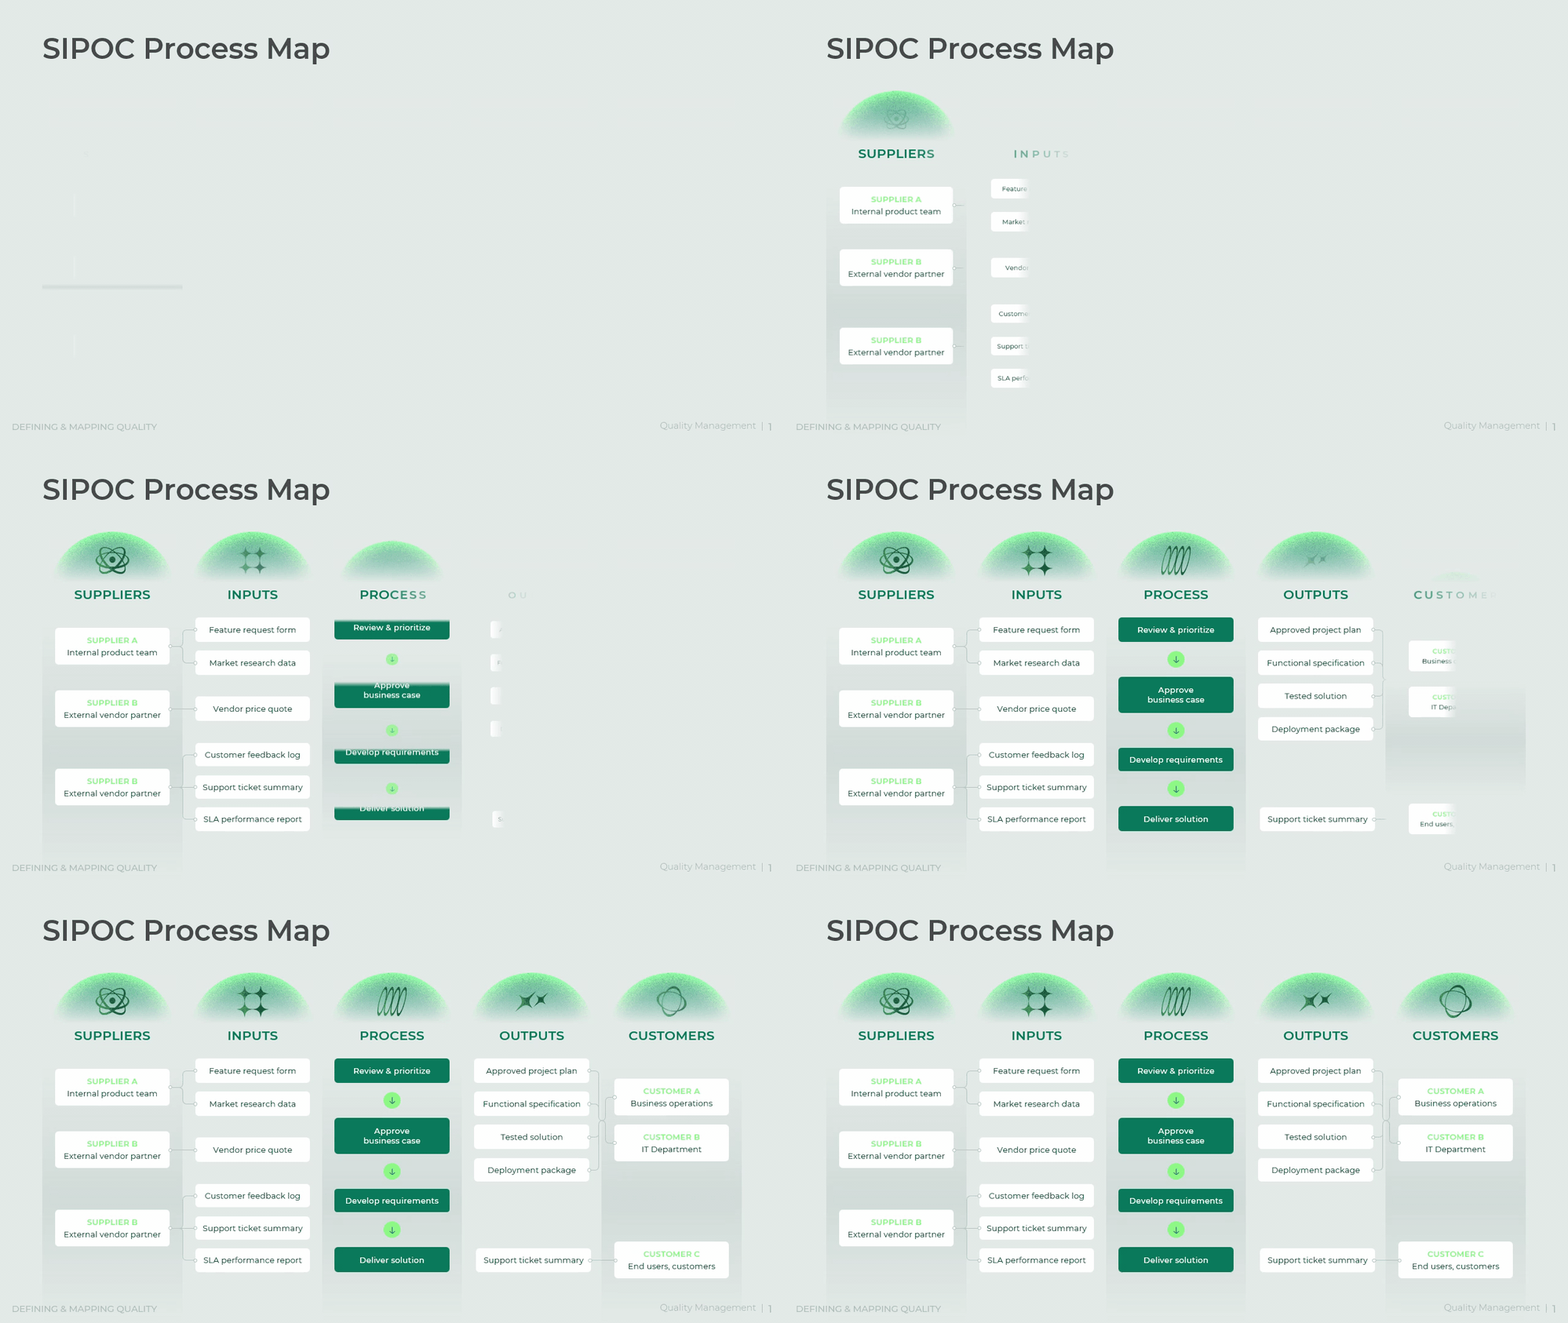
A known risk needs a control that catches it every time. Without a plan, controls live in people's heads and disappear when staff change. This framework records each control in one place. It pairs a preventive control that stops the defect with a detective control that catches any that slip through, and it sets the exact limit and the response when the limit breaks.
Statistical process control, the discipline behind these limits, traces back to Walter Shewhart at Bell Laboratories and remains the backbone of modern quality standards. Consider a plant with recurring seal leaks. Before a control plan, leaks reach customers. After the plan, a pressure test with a 1% leakage limit catches the defect on the line, and any breach triggers an automatic hold. The failure stops at the factory, not the field.
The Control Plan maps six failure modes: incorrect component, seal leakage, missing documentation, process drift, supplier defect, and labelling error. Each row carries a preventive control, a detective control, a numeric limit, and an escalation step. Seal leakage pairs approved supplier specifications with a pressure test, a limit of 1% or less leakage, and a "hold shipment" escalation. Process drift pairs locked parameters with SPC monitoring and a "stop and quarantine" response. Managers adapt the limits to their own tolerances and confirm each escalation names a real action, not a vague review.

Download presentation
Quality Management
PowerPoint
18 Slides
To continue, enter your email:
Measure Maturity and Steer with Live KPIs
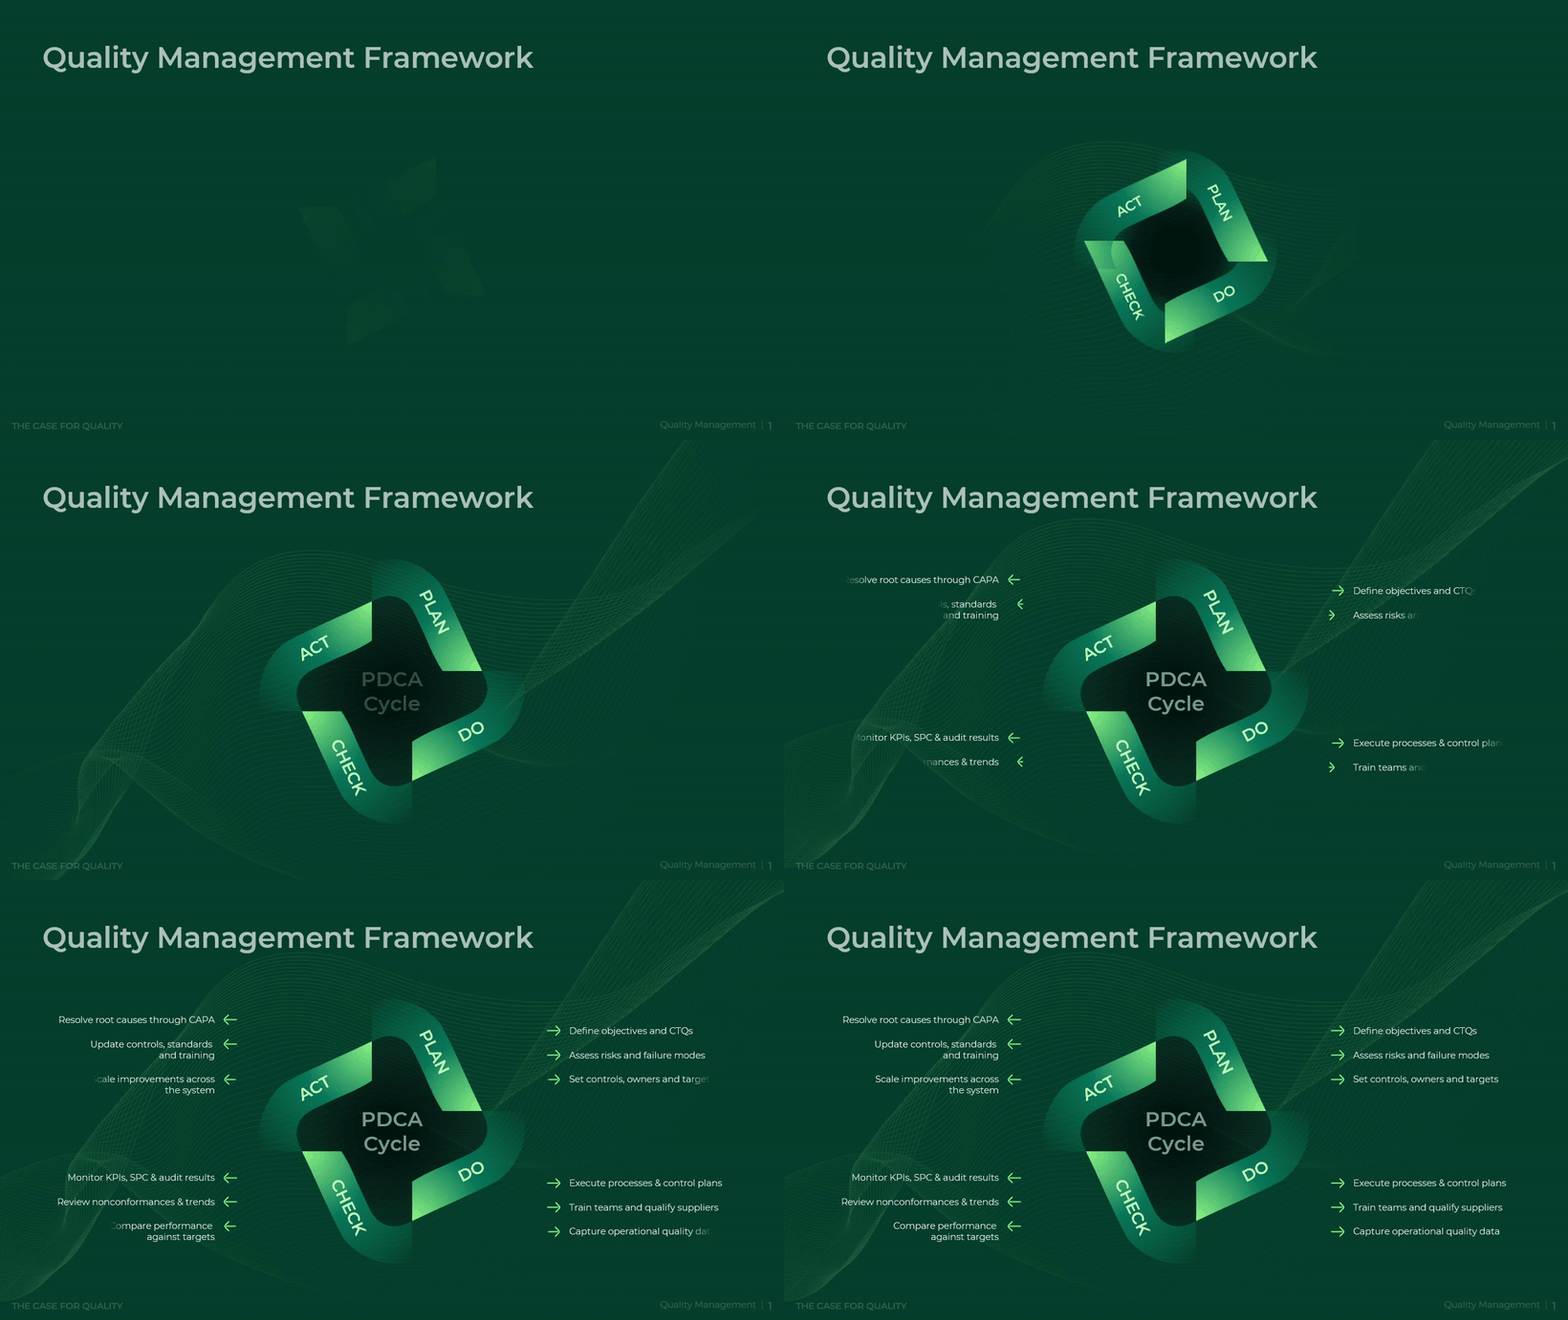
Quality improves only when an organization knows where it stands and where it aims to go. This framework closes the loop with three connected views. A maturity model sets the destination, a KPI dashboard tracks the present, and a roadmap sequences the path between them. Progress becomes visible and measurable at every level.
Structured measurement pays off. The framework's own cost model places external failure at $3.26M against just $1.01M of prevention investment, a gap that a disciplined metric set is built to close. When leaders can see where quality cost concentrates, they can move spend from failure toward prevention, where the return per dollar is higher. Measurement, not intent, drives that shift.
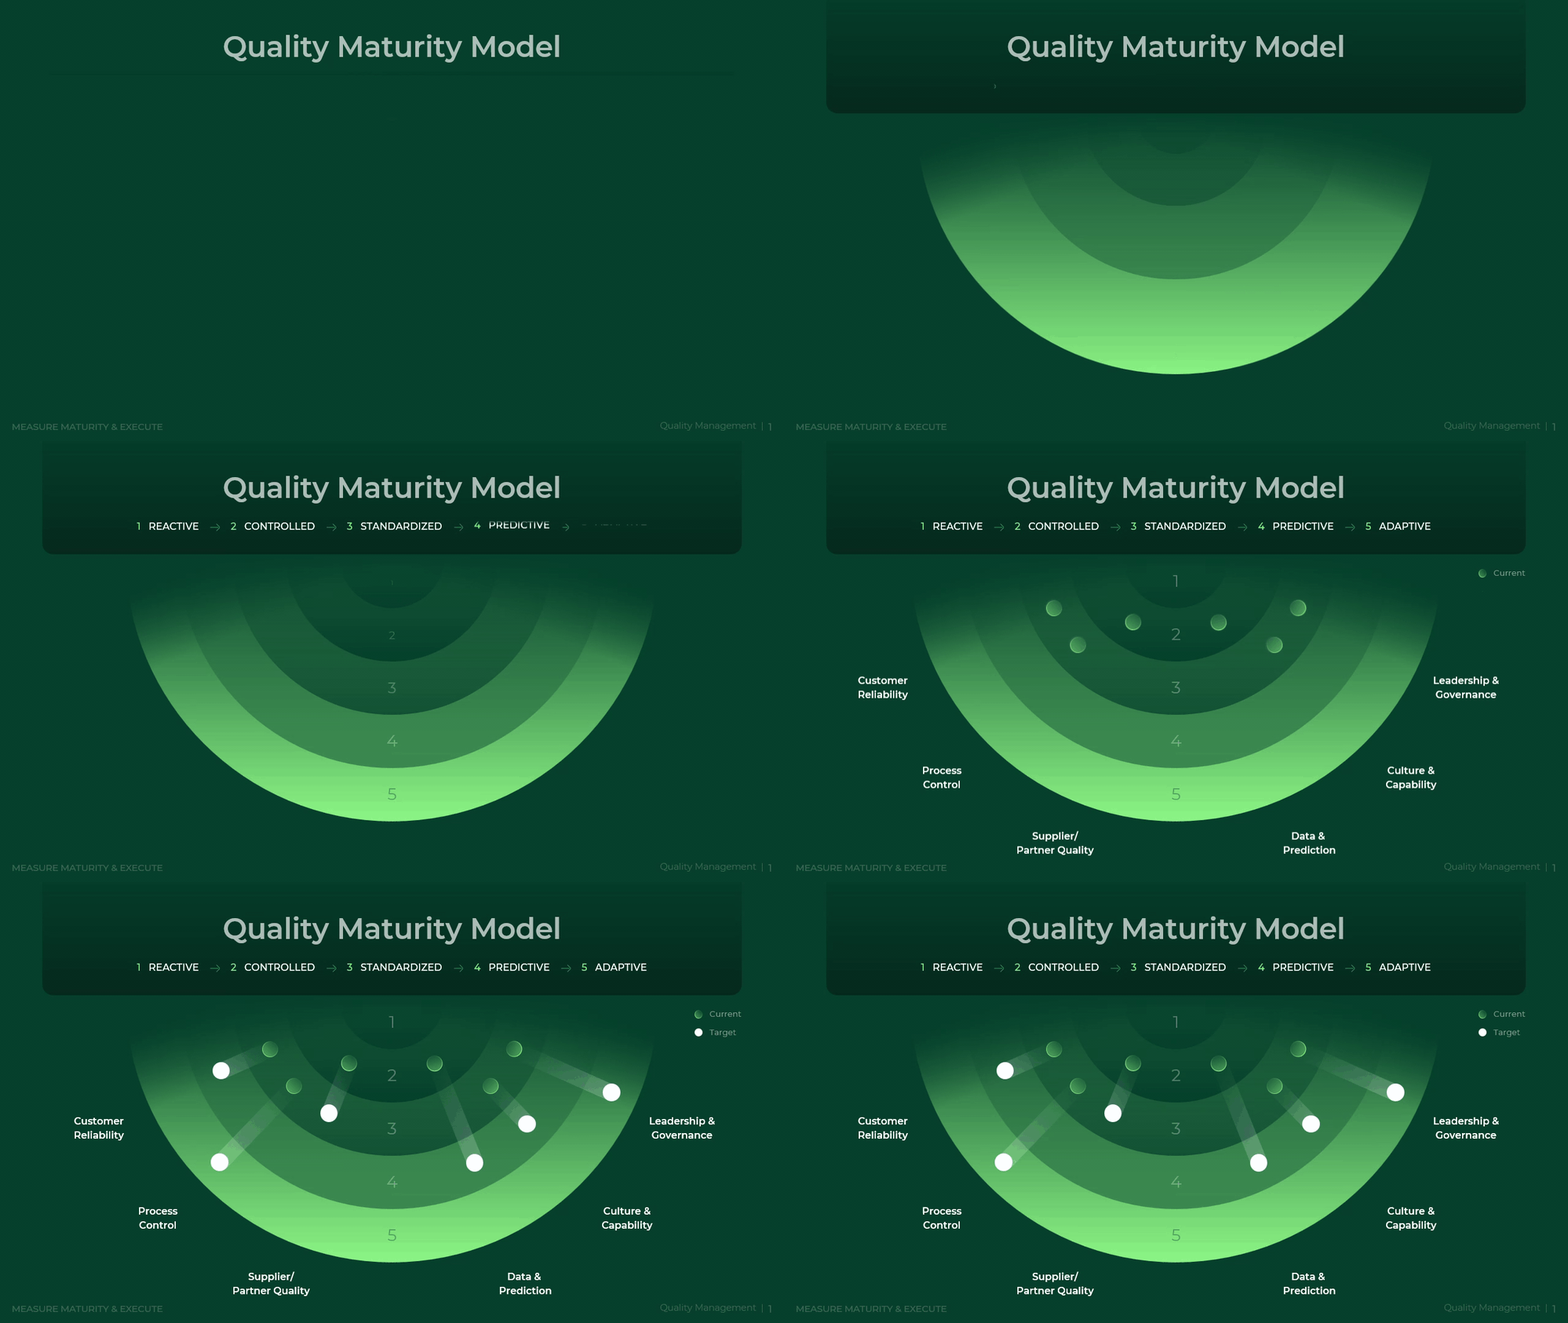
The Quality Maturity Model rates the organization across six dimensions, from Customer Reliability to Data and Prediction, on a five-stage scale that runs Reactive, Controlled, Standardized, Predictive, and Adaptive. Each dimension shows a current stage and a target stage, so the gap is explicit. Managers use this model in annual planning to agree on how far each area must advance and by when.
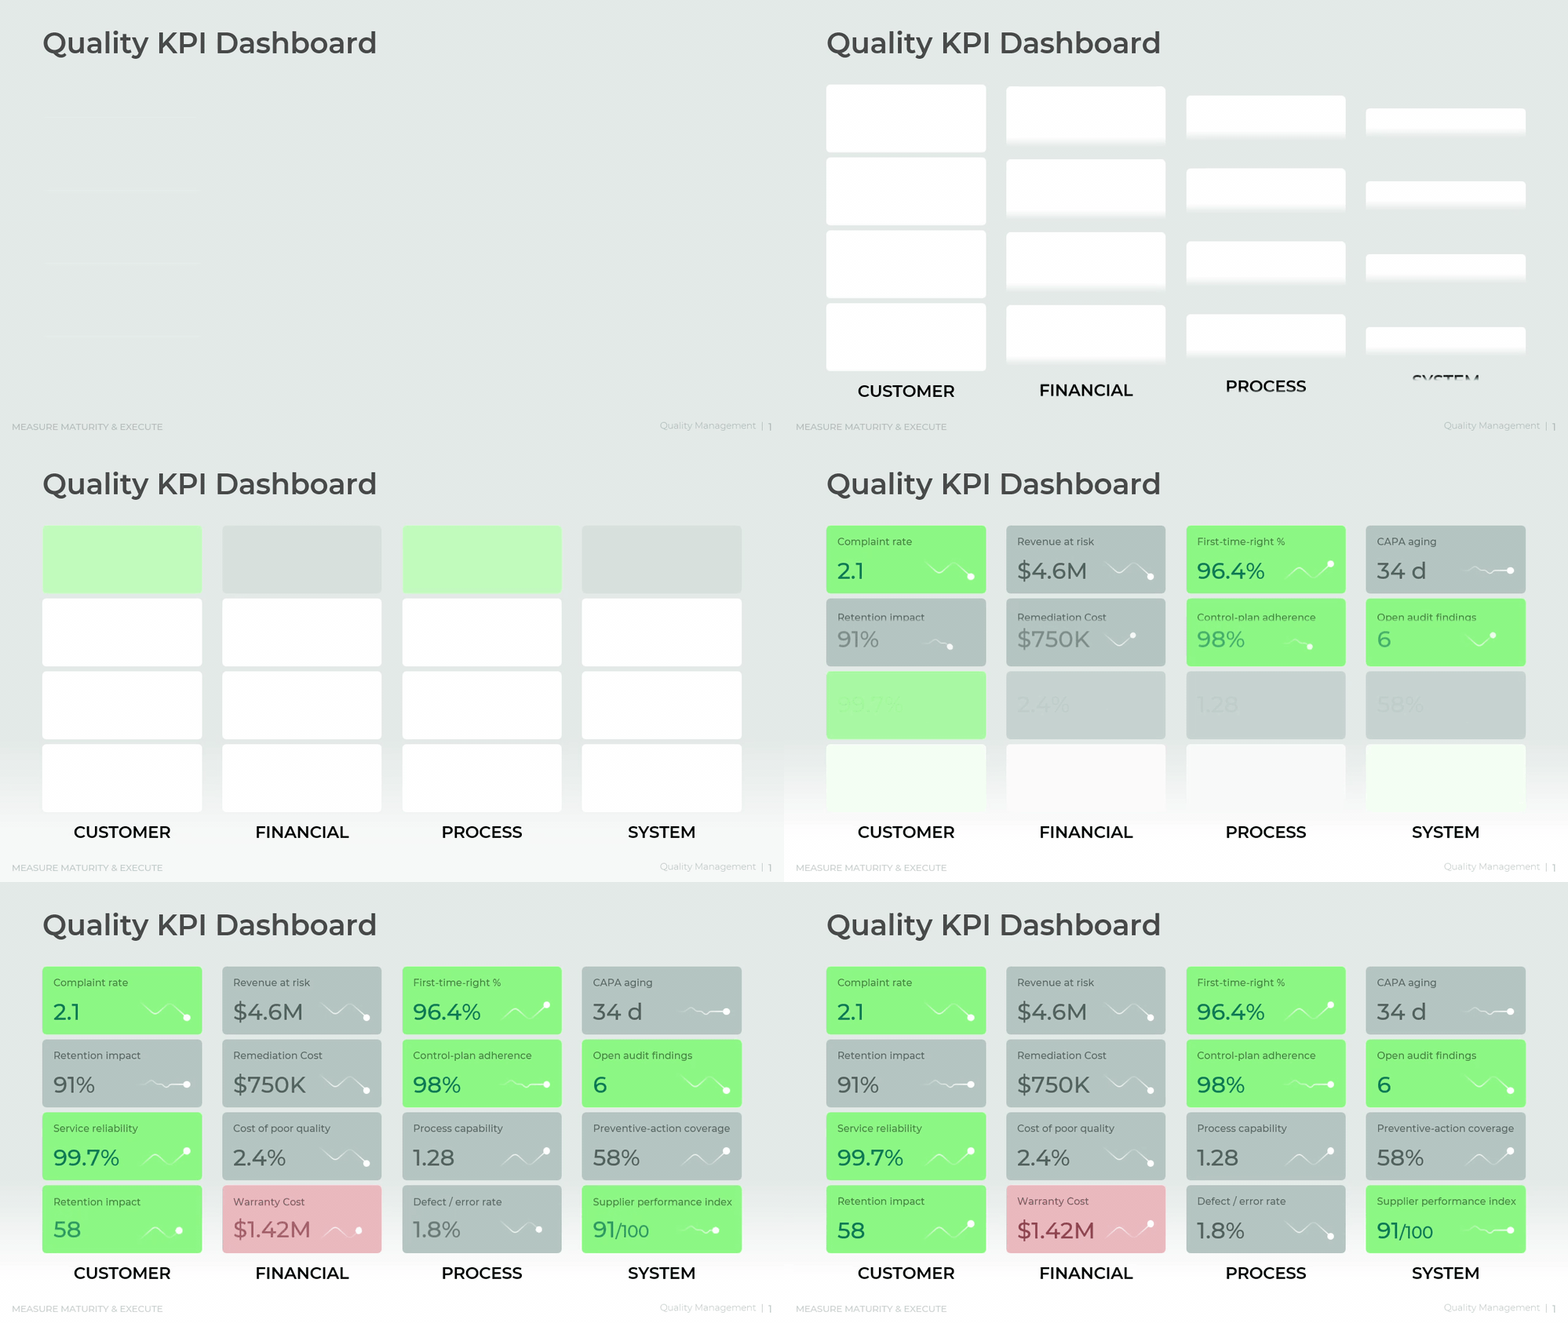
The Quality KPI Dashboard groups metrics under four lenses: Customer, Financial, Process, and System. It tracks complaint rate, revenue at risk, first-time-right percentage, CAPA aging, cost of poor quality, and more on one screen. Managers review it on a fixed cadence, watch for metrics that drift from target, and act before a single number becomes a trend.
The Implementation Roadmap sequences the work across four phases: Stabilize, Standardize, Digitize, and Optimize. Each phase carries a date and two concrete goals, such as "deploy control plans" in the first quarter and "60% predictive coverage" in the last. Managers use the roadmap to set realistic milestones and to keep the program from stalling after the early wins.

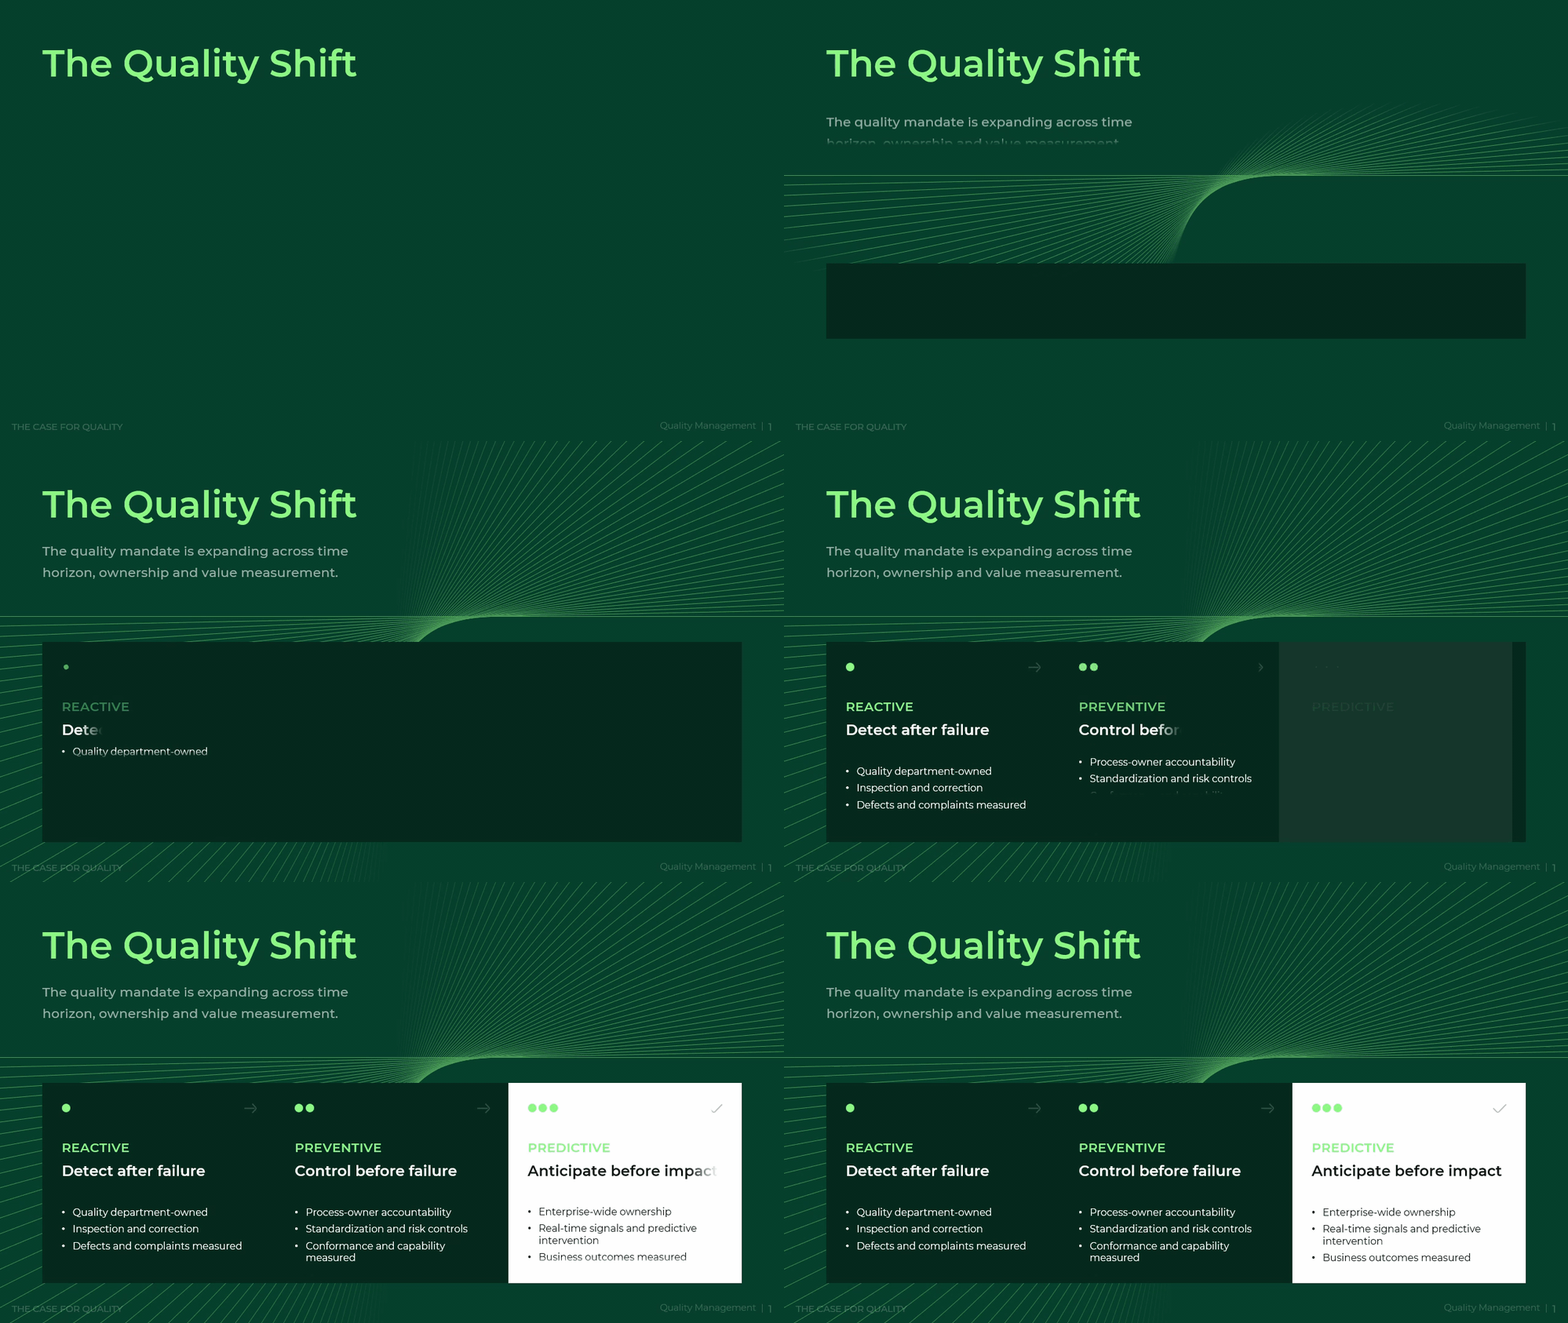
Quality is not a department or a final inspection. It is a discipline that connects the customer's true needs to the metrics a board reviews. The CTQ Tree defines what quality means in measurable terms. A culture of ownership makes that definition stick in daily behavior. Root cause analysis and FMEA find and rank the risks that threaten it. Control plans hold the line at the process level. A maturity model, a live dashboard, and a staged roadmap keep the whole system honest and moving forward. Together these parts move an organization from reactive detection, where failures are found after the fact, toward predictive prevention, where signals are read before impact. The shift is not only technical. It changes who owns quality, when it is measured, and how its value is judged. Organizations that treat quality as an enterprise-wide capability turn it from a cost center into a durable advantage.
Download presentation
Quality Management
PowerPoint
18 Slides
To continue, enter your email: