






Cost control usually stops at the negotiation table. It rarely reaches the design that created the cost. Lithium-ion battery packs sold for roughly $600 per kilowatt-hour in 2012 and reached a record low of $108 in 2025, according to BloombergNEF. The floor moved because someone questioned the number, not because suppliers volunteered a discount.
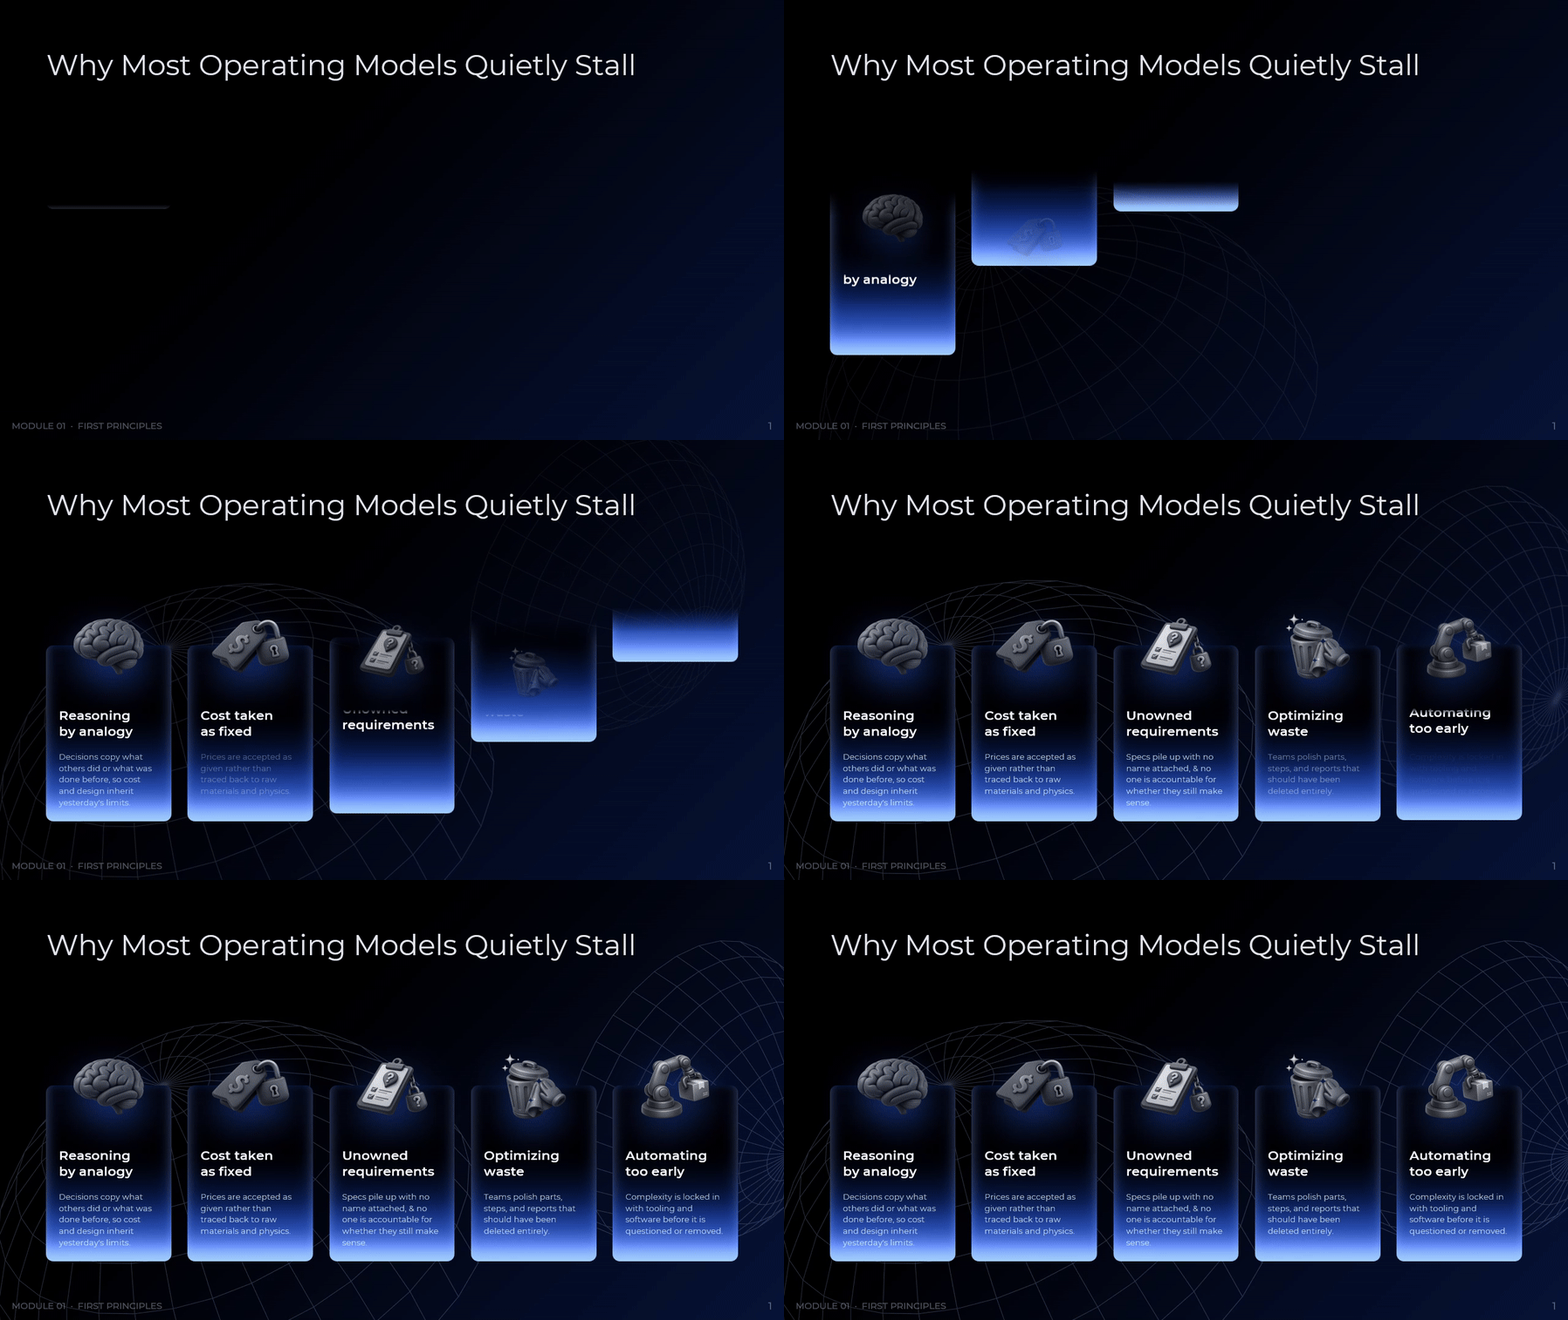
A new method lands better once a team names what the old habits cost. This diagnostic sets out five quiet failure patterns: decisions copied from precedent, prices accepted as given, requirements with no owner, waste that gets polished instead of removed, and complexity locked in by tooling too early. Each carries one plain line, so a leadership team can self-diagnose in under a minute. The best use is a show of hands. Managers mark the two patterns that describe their own unit, and those two become the test cases for everything that follows.
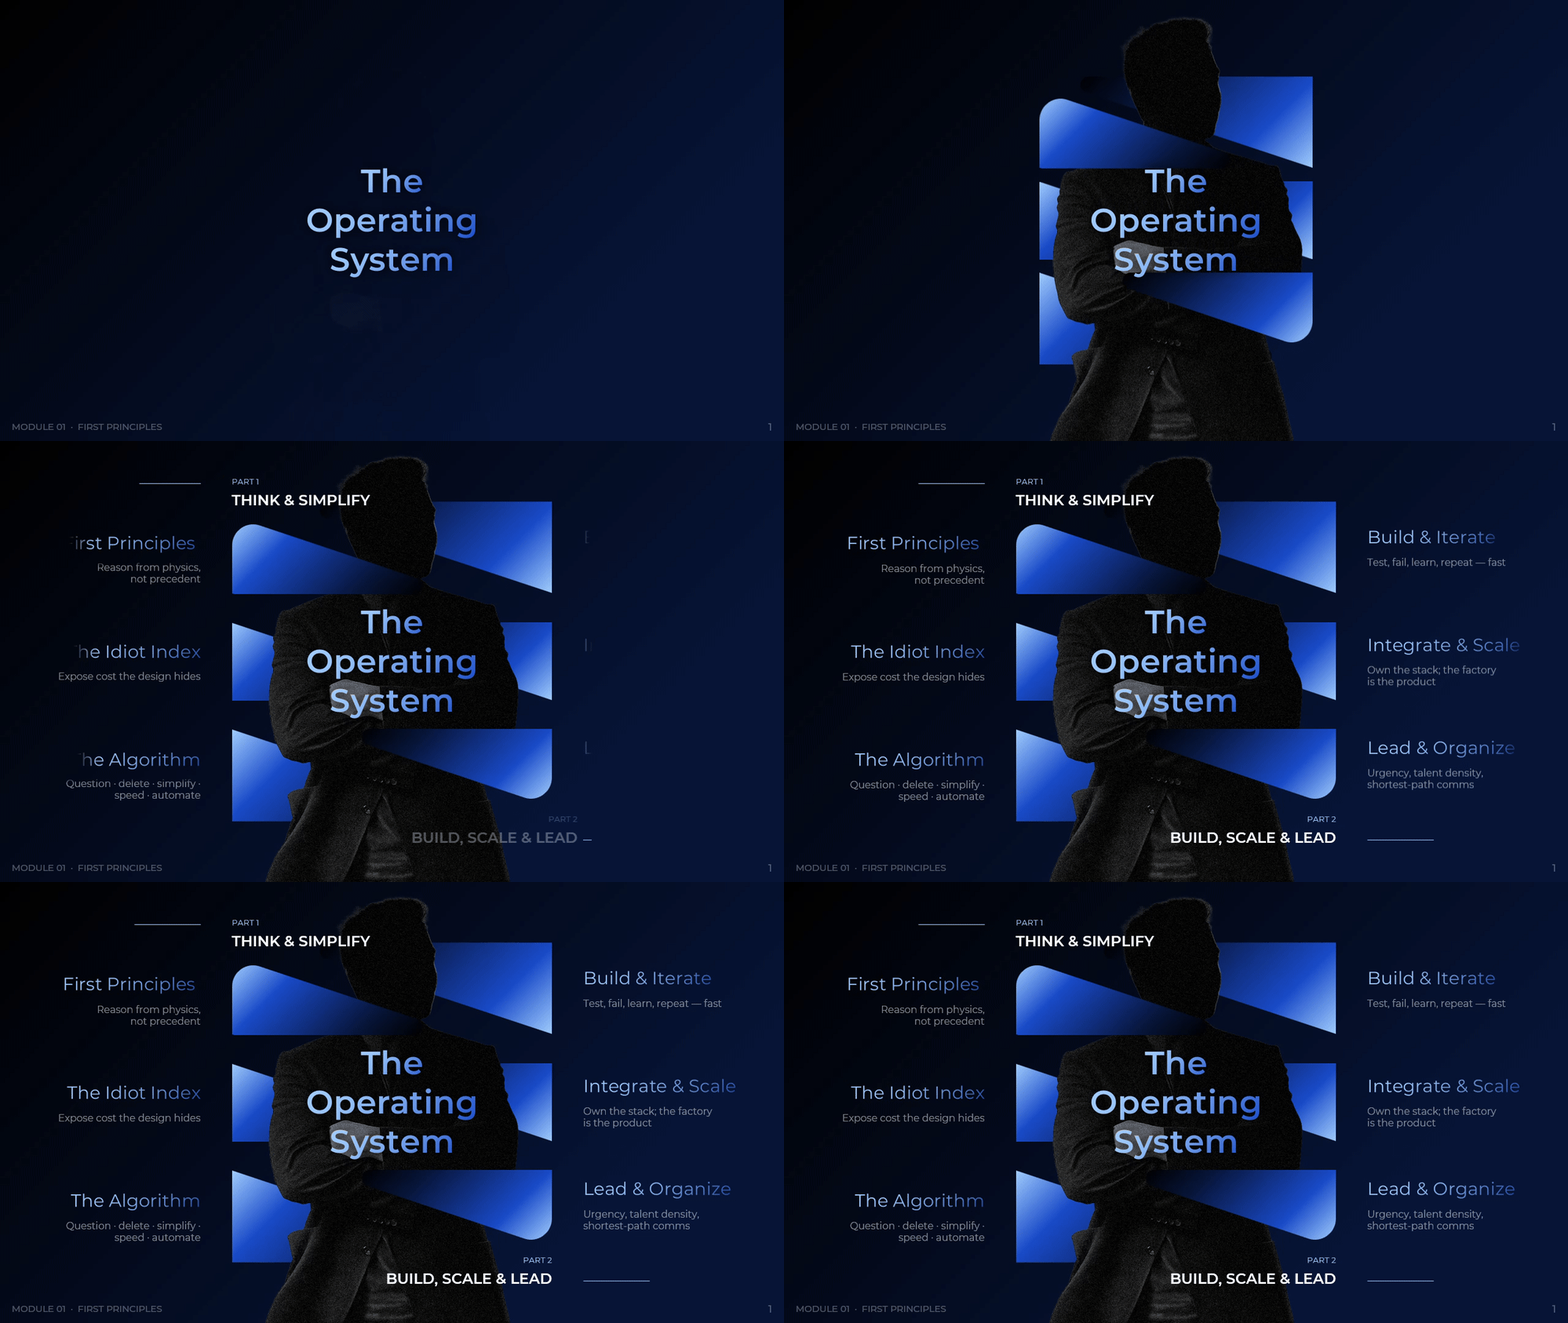
The next question is how the pieces connect. This map splits the system into two halves. Part one covers thought and simplification, and holds first principles and the idiot index. Part two covers build, scale, and leadership, and holds rapid iteration, vertical integration, and the five-step algorithm. Each component sits beside a one-line definition, which keeps a briefing from drifting into abstraction. Presenters should hold this slide on screen while they set the agenda, because it frames the material as an ordered system rather than a menu.
Reason From Physics, Not Precedent
Reasoning by analogy is fast and comfortable. It also imports the cost structure of whoever went first, and that inherited ceiling starts to look like a law of nature. First-principles reasoning breaks the link. It reduces a problem to raw materials, physical limits, and facts that can be checked, then rebuilds a solution from those facts alone. The floor is set by nature rather than convention, and the distance to it becomes a measurable opportunity.
The battery case makes the difference concrete. In a 2012 interview, Elon Musk described the accepted view that packs cost about $600 per kilowatt-hour and always would. He priced the constituent materials on the London Metal Exchange instead, and the raw-material figure came to roughly $80. Harvard Business School researchers Giovanni Gavetti and Jan Rivkin made a related point in Harvard Business Review: managers reason by analogy constantly and rarely notice that they do it.
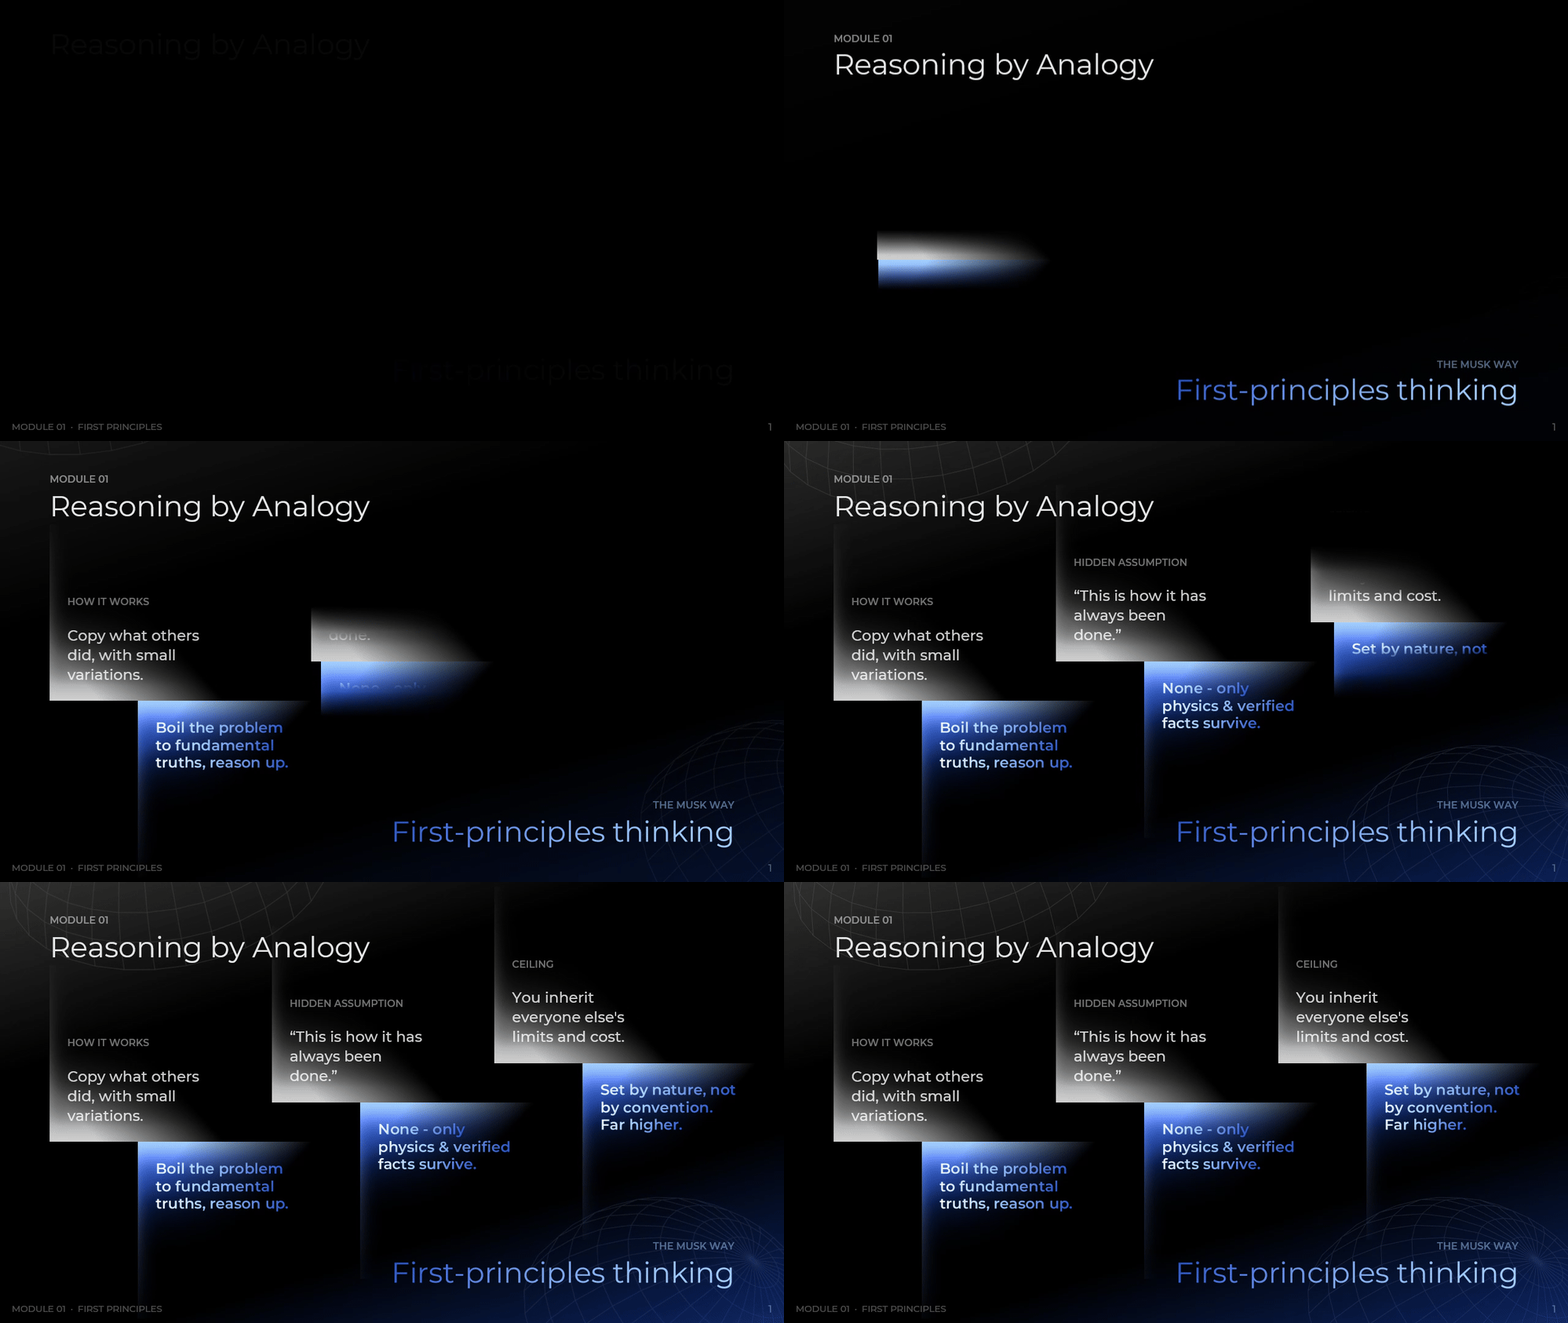
The comparison slide opens the module when a team insists a constraint is fixed. Two columns sit side by side, analogy against first principles, compared on three rows: how the method works, the hidden assumption it carries, and the ceiling it produces. Workshop leads should write a live example into each column before discussion opens, because a generic contrast persuades no one.
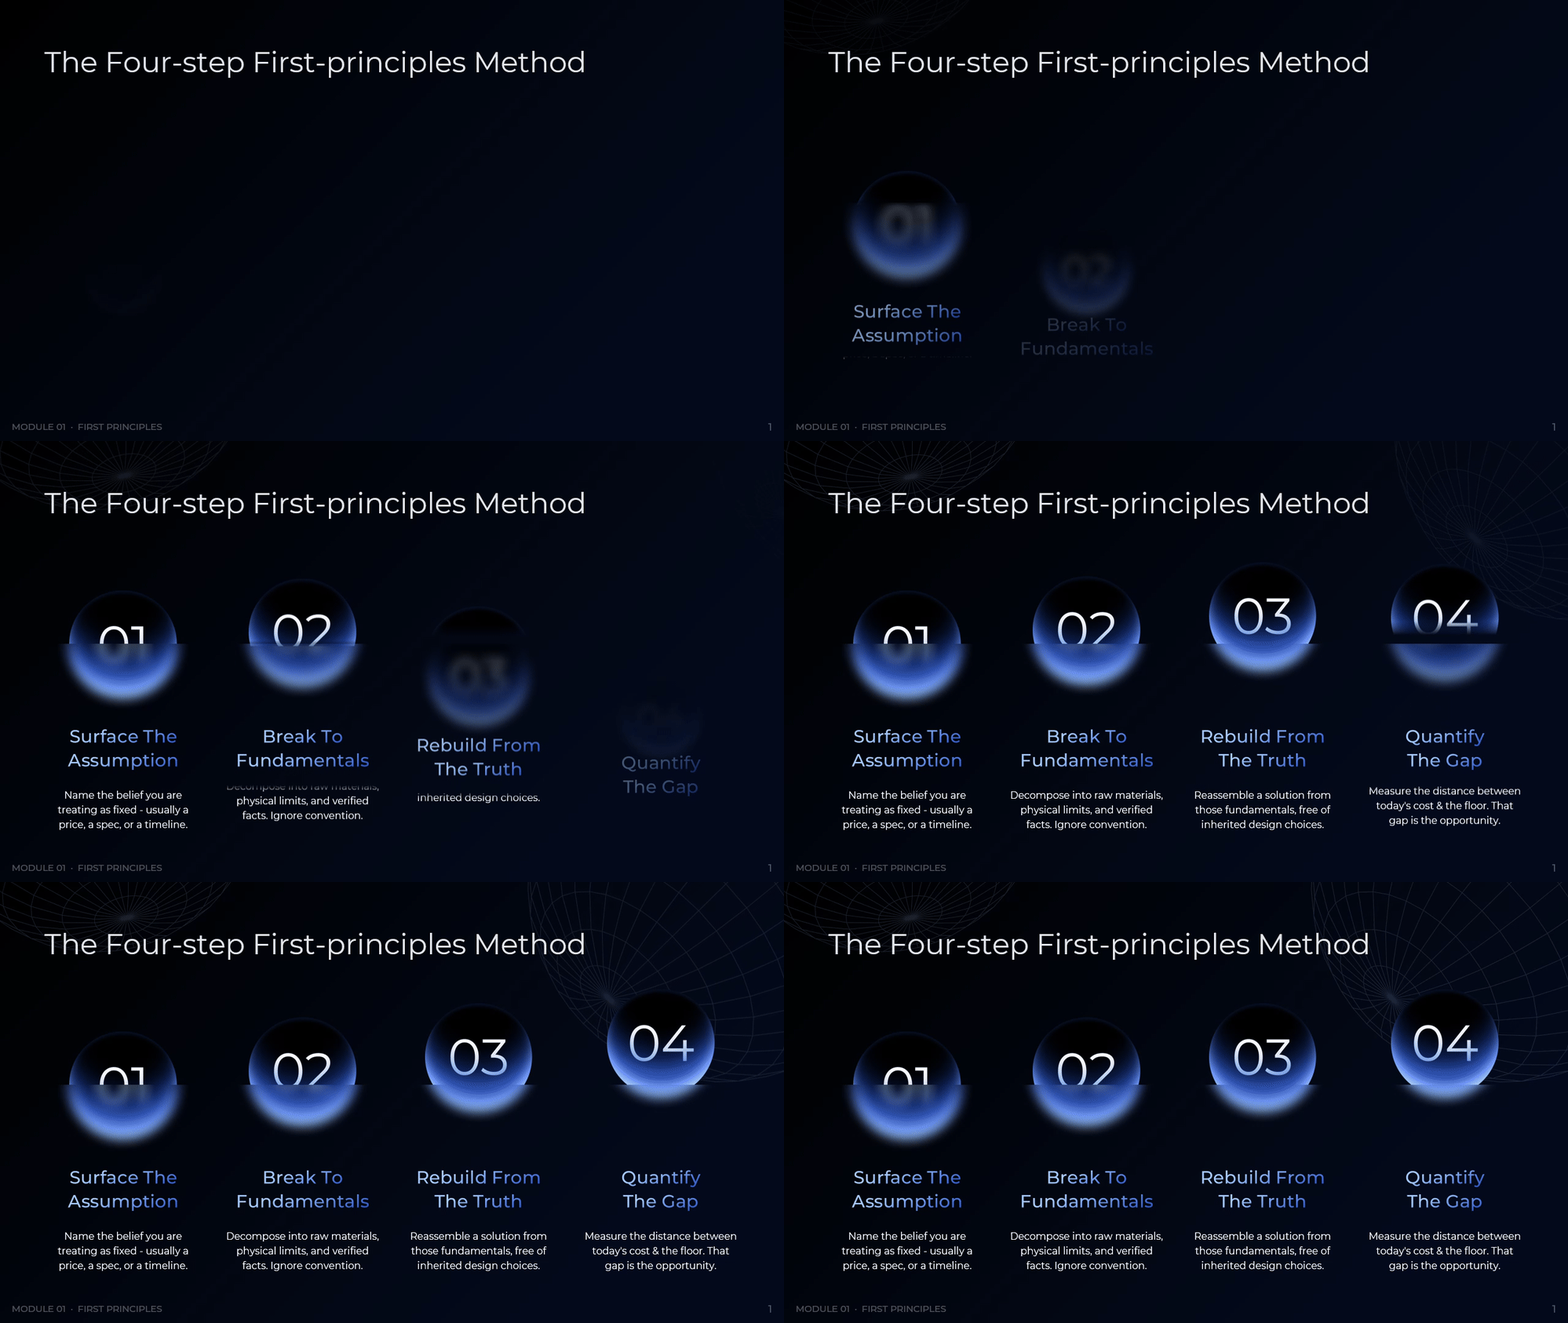
The method slide turns the idea into four ordered moves: surface the assumption, break the problem to fundamentals, rebuild from the verified truth, and quantify the gap. The order matters more than the labels. Teams that jump straight to the rebuild produce a redesign with no number attached, and a redesign with no number rarely wins funding.
The worked example gives the method a proof point. It sets the conventional figure of $600 per kilowatt-hour against a first-principles figure of $80 and marks the ratio at 7.5 times. Teams should rebuild the same comparison with their own highest-spend component, since a borrowed example impresses an audience while a local one changes a budget.

The canvas is the working surface. Four numbered columns ask what assumption is accepted, what the verifiable facts are, how the solution would be rebuilt, and where the opportunity sits. The battery case appears as a filled example, which sets the expected level of detail. Teams should clear it and complete column one first, with no debate about solutions, because solutions written too early restate the assumption in new words.

Measure The Cost A Design Hides
Most cost programs treat a supplier quote as the unit of analysis. The idiot index treats the design as the unit instead. It divides the finished cost of a part by the cost of the raw material inside it. A high ratio points at complexity, excess process steps, or margin extracted from a buyer who never checked. The number converts a vague sense that something costs too much into a ranked list, and a ranked list is something engineering can act on this quarter.
Walter Isaacson records that Musk applied this ratio across SpaceX and Tesla, and that a part costing $1,000 with $100 of aluminum inside signals a design that is too complex or a process that is too inefficient. The logic scales down cleanly. A mid-size manufacturer with 400 purchased parts can compute the ratio for all of them from a bill of materials and a commodity price sheet.
The index slide carries the calculation and the ranking in one view. The formula sits at the top, finished-part cost divided by raw-material cost. Five example parts run below in descending order, from a machined valve body at 25 down to an aluminum housing at 1.4, each with a short note on what drives the gap. Reviewers should check that every high ratio has a stated cause, because a ratio with no explanation is a number rather than a lead.

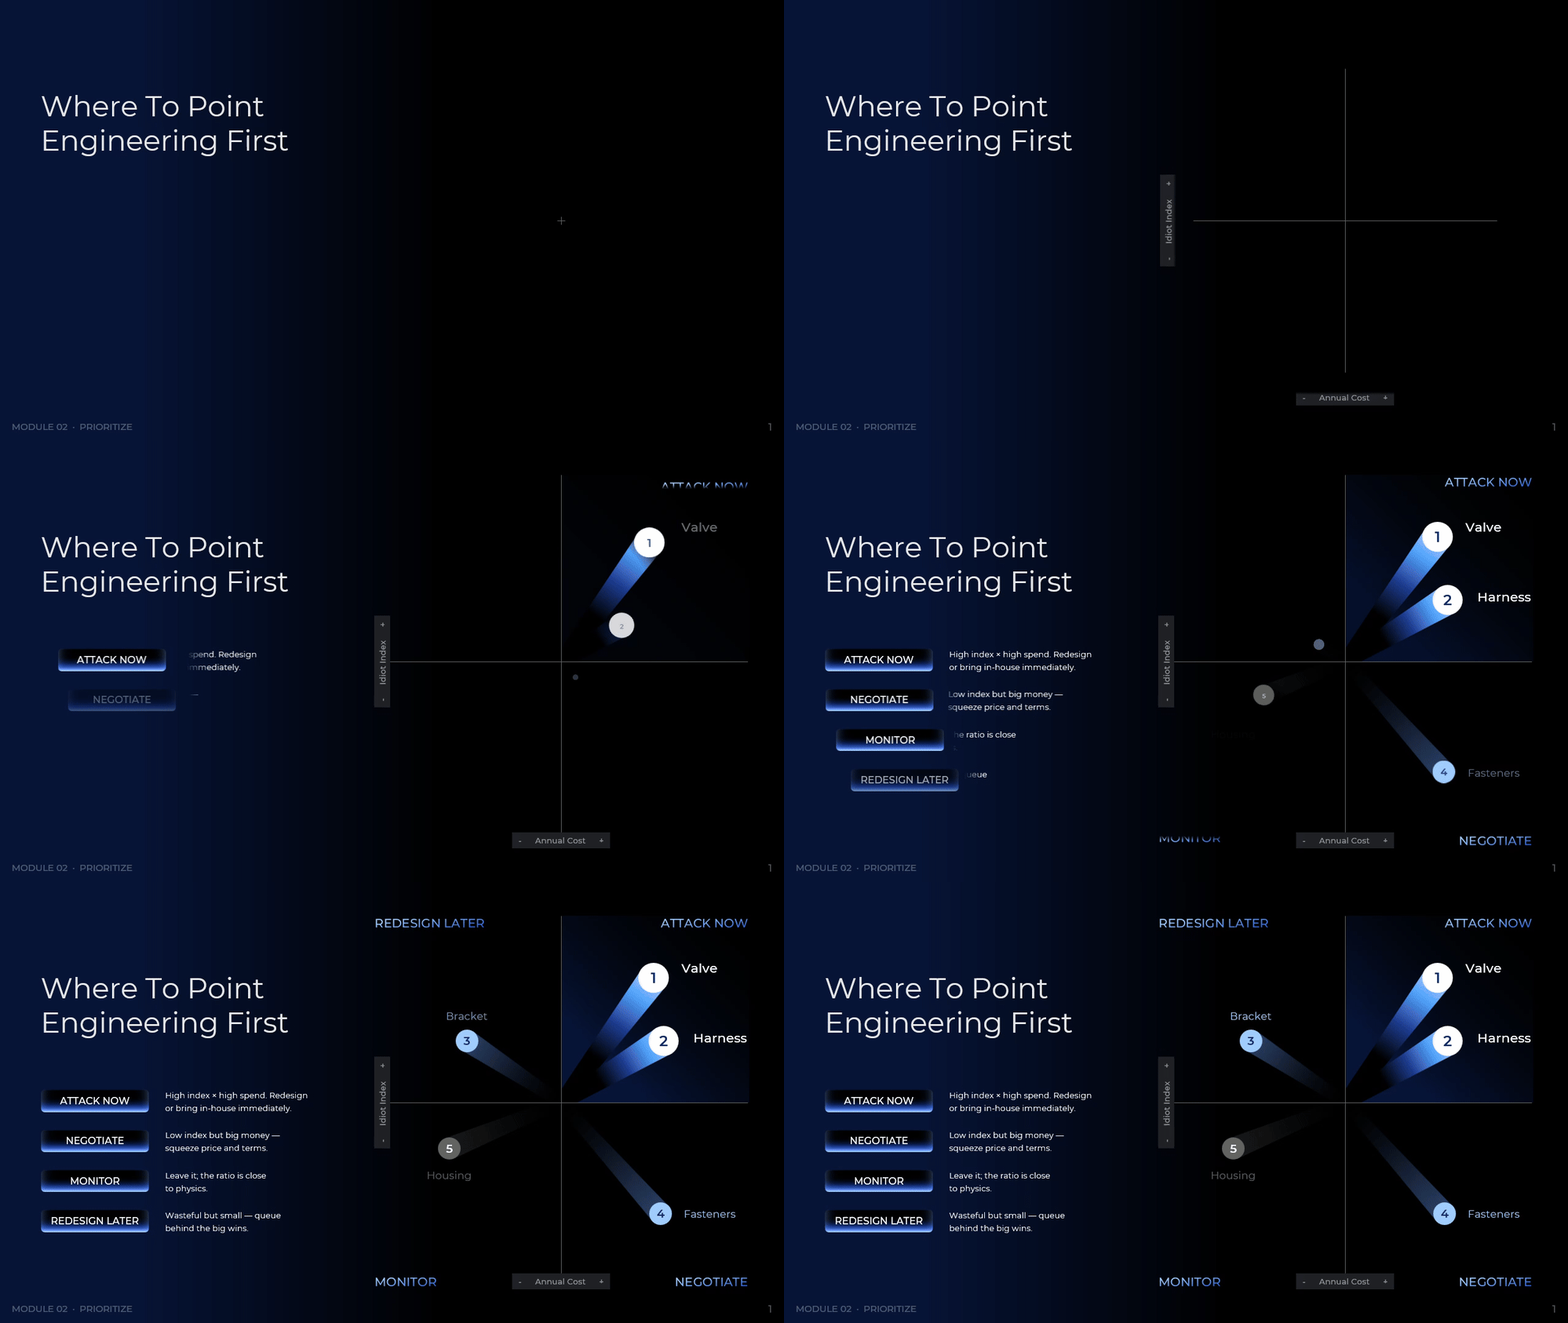
A high ratio on a small part is a distraction, which the prioritization matrix corrects. It plots idiot index against annual spend and splits the field into four zones. High index with high spend means attack now, through redesign or in-house production. Low index with high spend means negotiate, since the design already sits close to physics. High index with low spend joins a later redesign queue. Teams should place their top twenty parts on this grid before any redesign budget is committed.
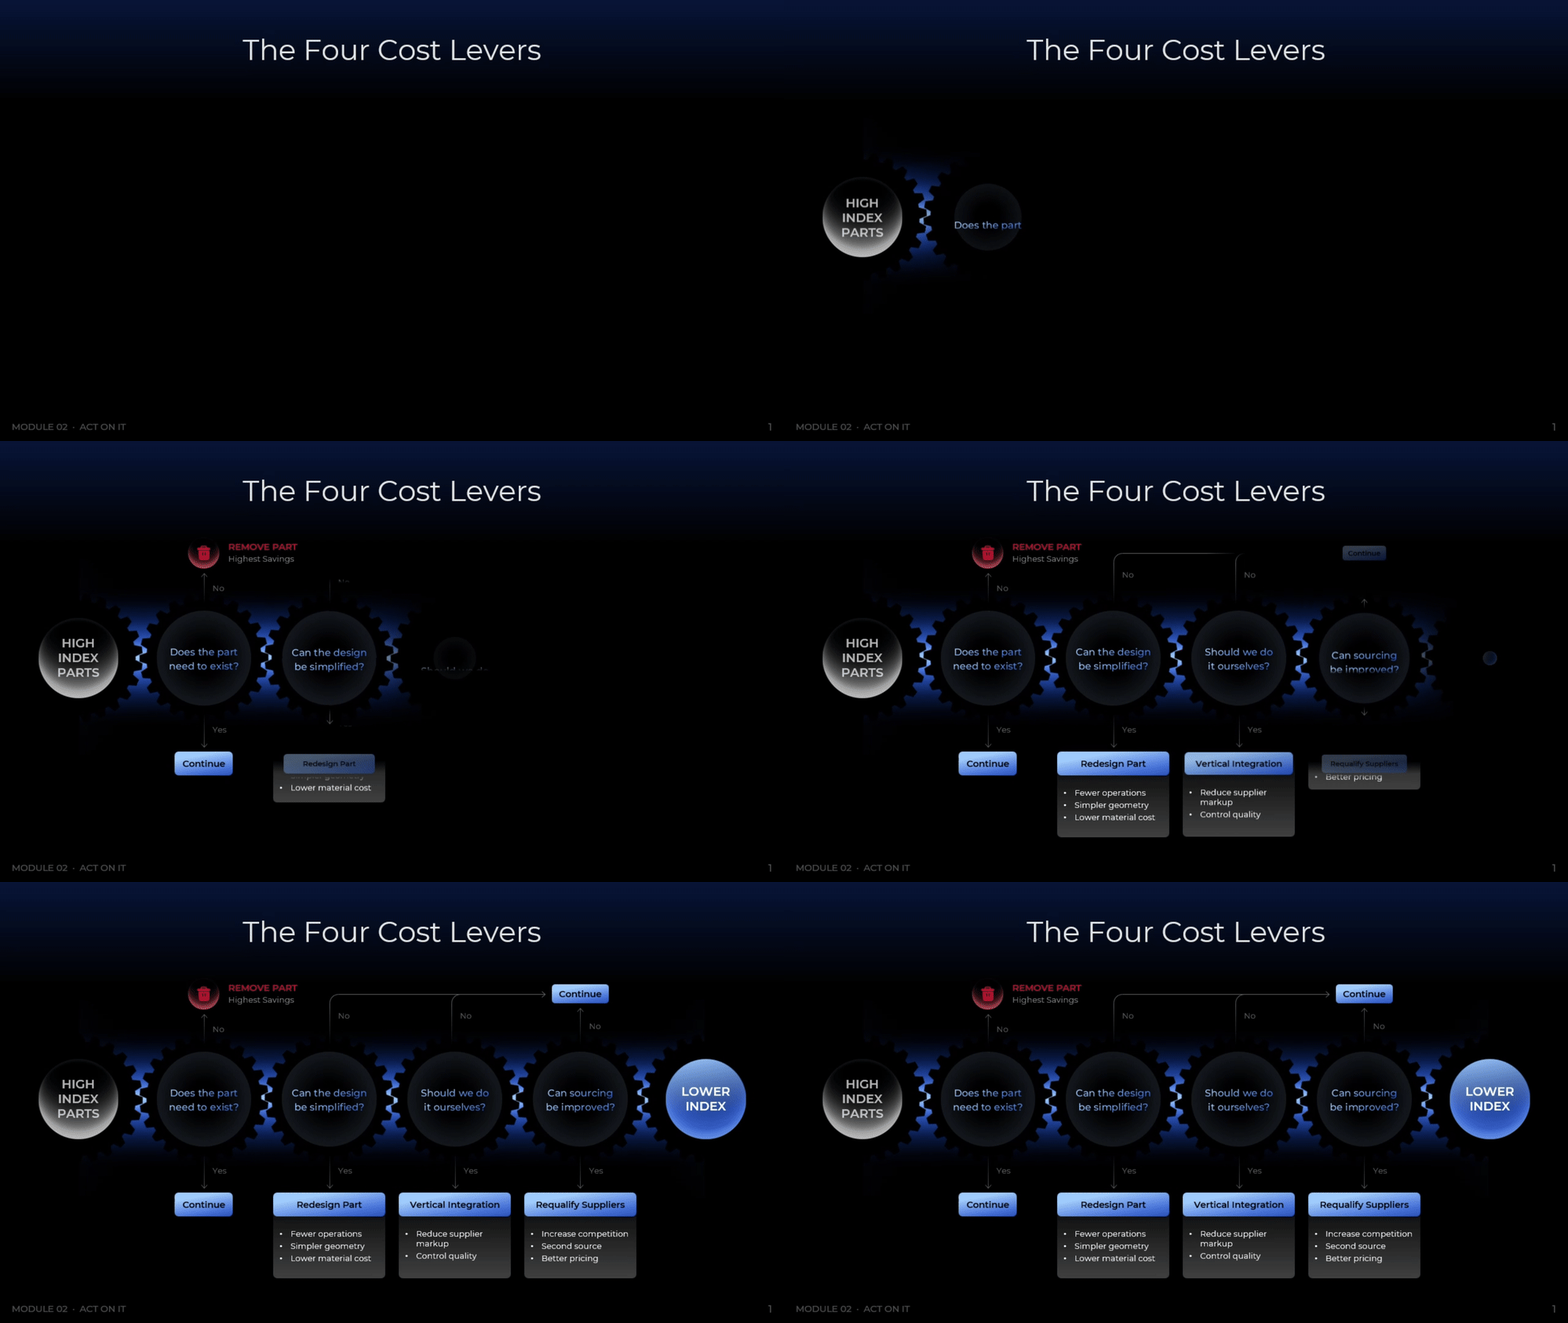
Once a part is flagged, the question becomes which lever to pull. This decision tree runs four gates in order: does the part need to exist, can the design be simplified, should the work move in-house, and can sourcing improve. A yes at the first gate removes the part entirely, the highest-value outcome. Each terminal branch names its own payoff, from fewer operations to reduced supplier markup. The sequence forces the deletion question ahead of the sourcing question, which reverses how most procurement reviews run.
Download presentation

The First Principles Operating System
PowerPoint
20 Slides
To continue, enter your email:
Question And Delete Before Anything Else
Process improvement usually starts with optimization, and that order is expensive. Effort goes into steps that should not exist, and the improvement locks each step in place. The algorithm reverses the order. Requirements get questioned first, parts and steps get deleted second, and only survivors move forward for refinement. The payoff is a smaller system to run. Fewer approvals, reports, and inspections mean less coordination overhead, and coordination overhead is the cost that never appears on a line item.
The scale of that hidden cost is measurable. Bain and Company found that the average company loses more than 20 percent of its productive capacity, over a day each week, to what it calls organizational drag: the structures and processes that consume time and prevent people from finishing work. A 200-person firm at that level carries the equivalent of 40 people who produce nothing, and no budget line records it.
The sequence slide is the reference card for the module. Five steps run in fixed order: question every requirement, delete the part or process, simplify and optimize, accelerate cycle time, and automate. Each carries a one-line rule, including the instruction that automation comes last and never first. Managers should keep this slide visible during design reviews, so anyone who proposes tooling for an unproven process can be pointed back to the step the team skipped.

Step one fails quietly when a requirement has no owner. This slide supplies three rules: assign ownership, because requirements come from people rather than departments; question authority, because requirements from respected experts get challenged least; and assume every requirement is optional until proven otherwise. The practical test is a name. A spec no one will claim is a spec no one is defending, and those survive for a decade past their usefulness.

Deletion needs a stopping rule, or teams cut too little and call it discipline. This slide supplies one: if under 10 percent of what was deleted has to come back, the deletion did not go far enough. Six targets surround the rule and extend it past the factory floor: parts, process steps, metrics, meetings, approvals, and inventory buffers. Each carries a line on what makes it a candidate, such as reports nobody acts on. Teams should track the add-back rate as a real number, because a rule with no measurement becomes a slogan.

Simplify, Accelerate, Then Automate
The last three steps carry the gains, and each depends on the one before it. Simplification applied to a reduced set of parts compounds, because less remains to standardize. Speed applied to a simplified process compounds again. Automation applied last locks in a design that has earned its shape. Run in the wrong order, the same three steps produce an expensive, fast, highly automated version of work the organization should have deleted.
Musk described the failure mode directly on the 2021 Starbase tour, when he told Everyday Astronaut that the most common error of a smart engineer is to optimize something that should not exist. The pattern is familiar in service work. A finance team that automates a monthly reconciliation report has locked the report in, and the reconciliation nobody reads now runs faster and costs more to change than before.
The simplification slide shows what remains after deletion: the original design, the aggressive deletion pass, then optimization applied only to survivors, with the emphasis on reduced complexity and standardization. Managers should apply this step only to items that cleared the deletion audit, and should ask for the before-and-after part count on the slide itself, since a simplification pass with no count is a design opinion.

Steps four and five need a gate, and this slide provides one. Three conditions must be met before automation begins: requirements questioned, unnecessary work removed, and the remaining process optimized. A quotation on the same slide states the point, that acceleration of something which should not exist is absurd. Teams should treat the three conditions as a literal checklist in the automation business case, with a named owner against each, because automation spending is the hardest to reverse once committed.

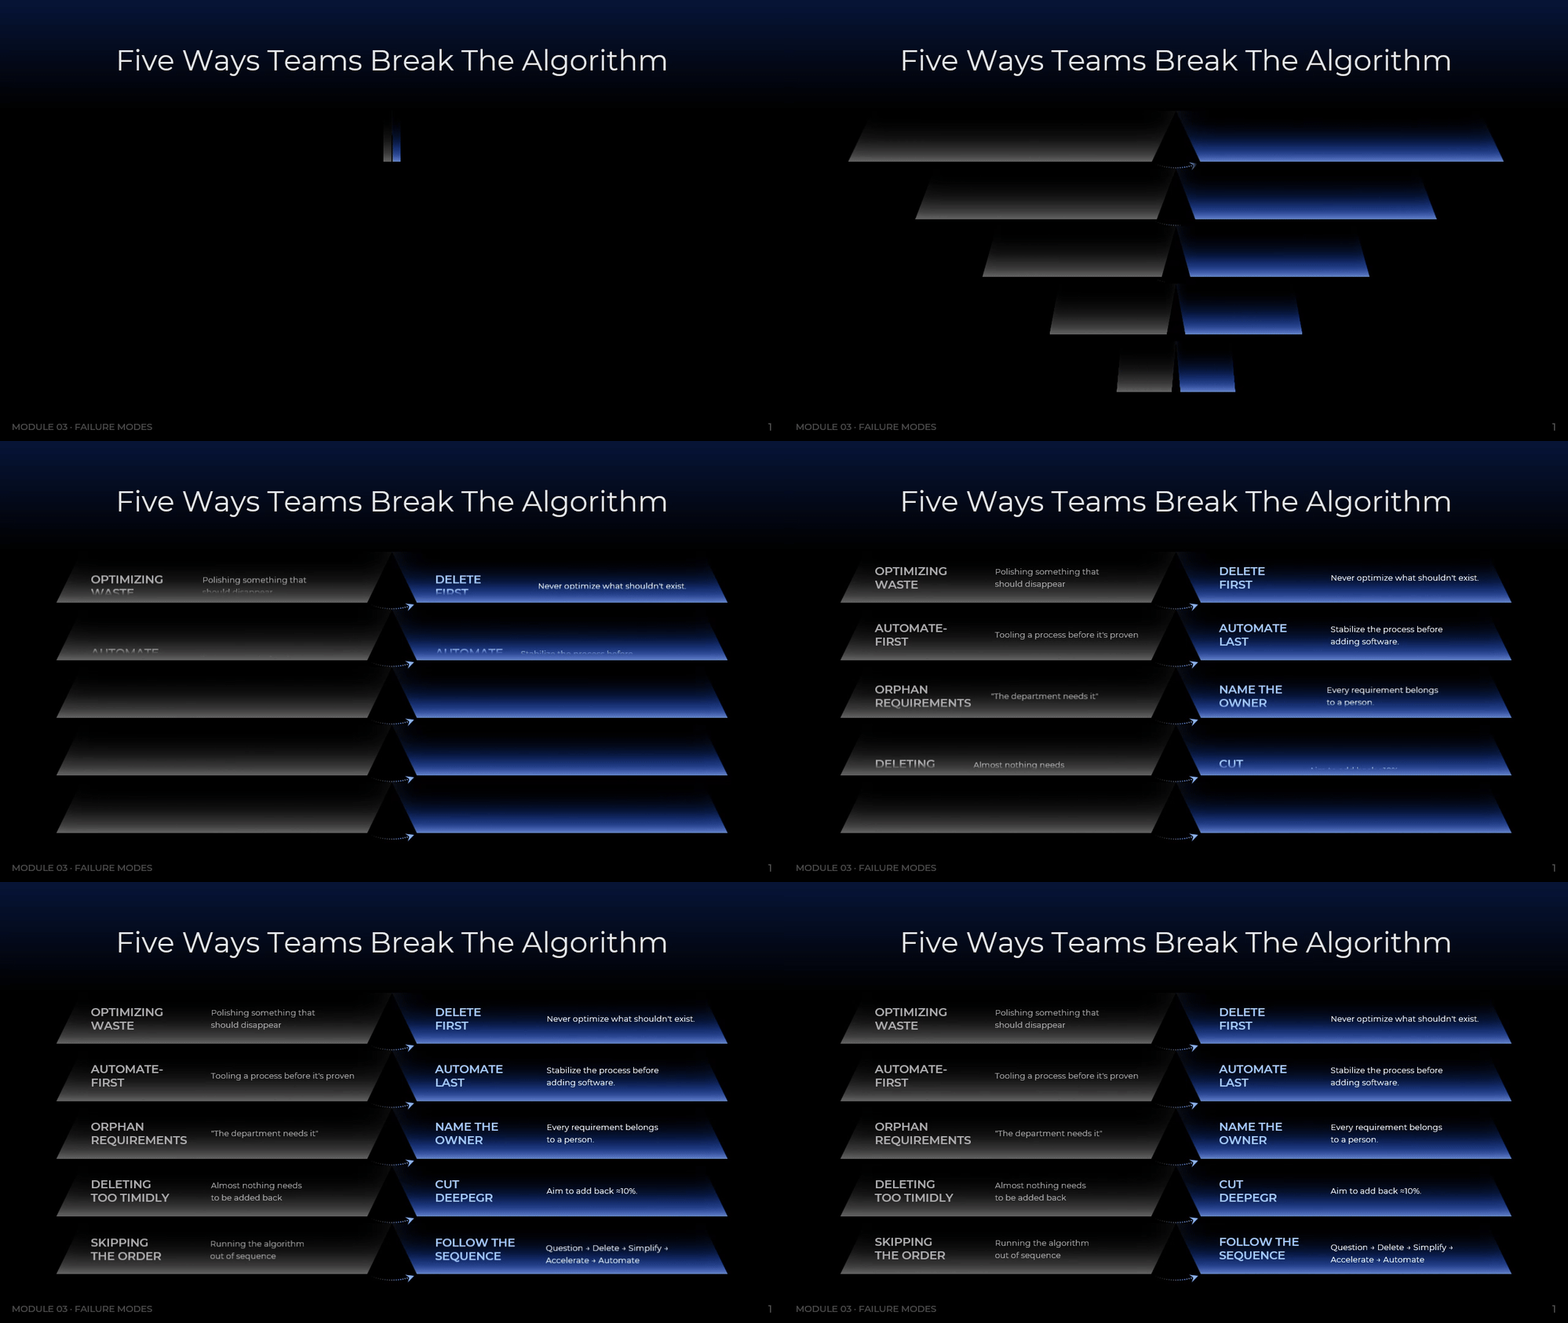
Failure modes deserve their own slide, and this one names five: optimization of waste, automation before stability, orphan requirements defended only by a department, timid deletion, and steps run out of sequence. Each sits opposite its correction, which turns the slide into a review checklist rather than a warning. In a quarterly retrospective, a team marks the patterns it committed, and the marked ones set the next agenda.
Download presentation
The First Principles Operating System
PowerPoint
20 Slides
To continue, enter your email:
Turn The Method Into A Standing Habit
A method used once produces a project. A method used every month produces an operating capability. The difference is ritual: a fixed cadence, a named owner, and a written record of what was cut and why. Organizations that install that cadence stop rediscovering the same waste each year, because the decision log carries the reasoning forward. Complexity returns quietly through small additions, and only a recurring review catches it early enough to matter.
Consider a 300-person services firm that runs the audit each quarter. It lists every recurring meeting, report, and approval in one department, removes each on paper, and restores only what actually breaks. If restorations come in under 10 percent, the rule says cut deeper. Two cycles of that discipline typically return several hours a week per manager, drawn from the same organizational drag that Bain measured at more than 20 percent of productive capacity.
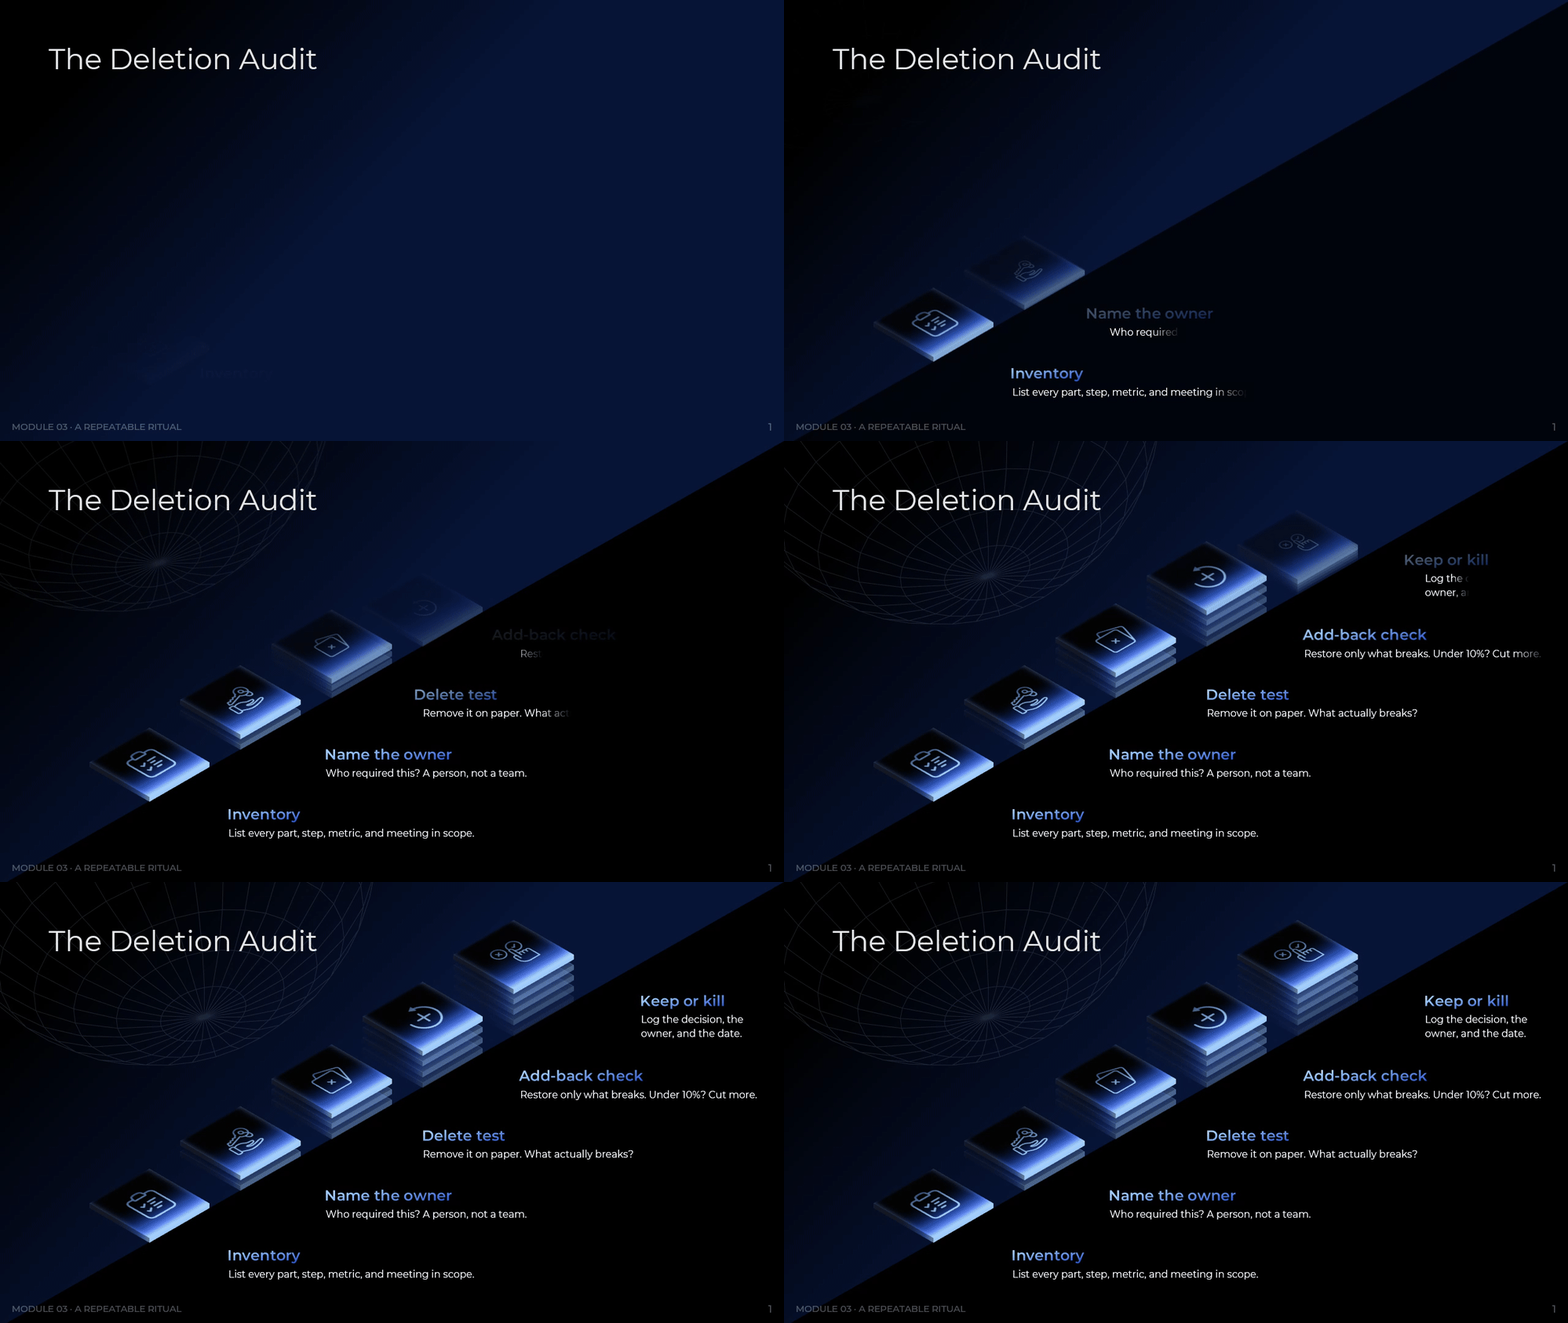
The audit slide turns the algorithm into a repeatable ritual with five stages: inventory everything in scope, name the owner of each item, run the delete test on paper, check the add-back rate against the 10 percent threshold, and log the keep-or-kill decision with its owner and date. The logging stage is the one teams skip and the one that carries the value. Departments should run the full loop on one process family at a time.
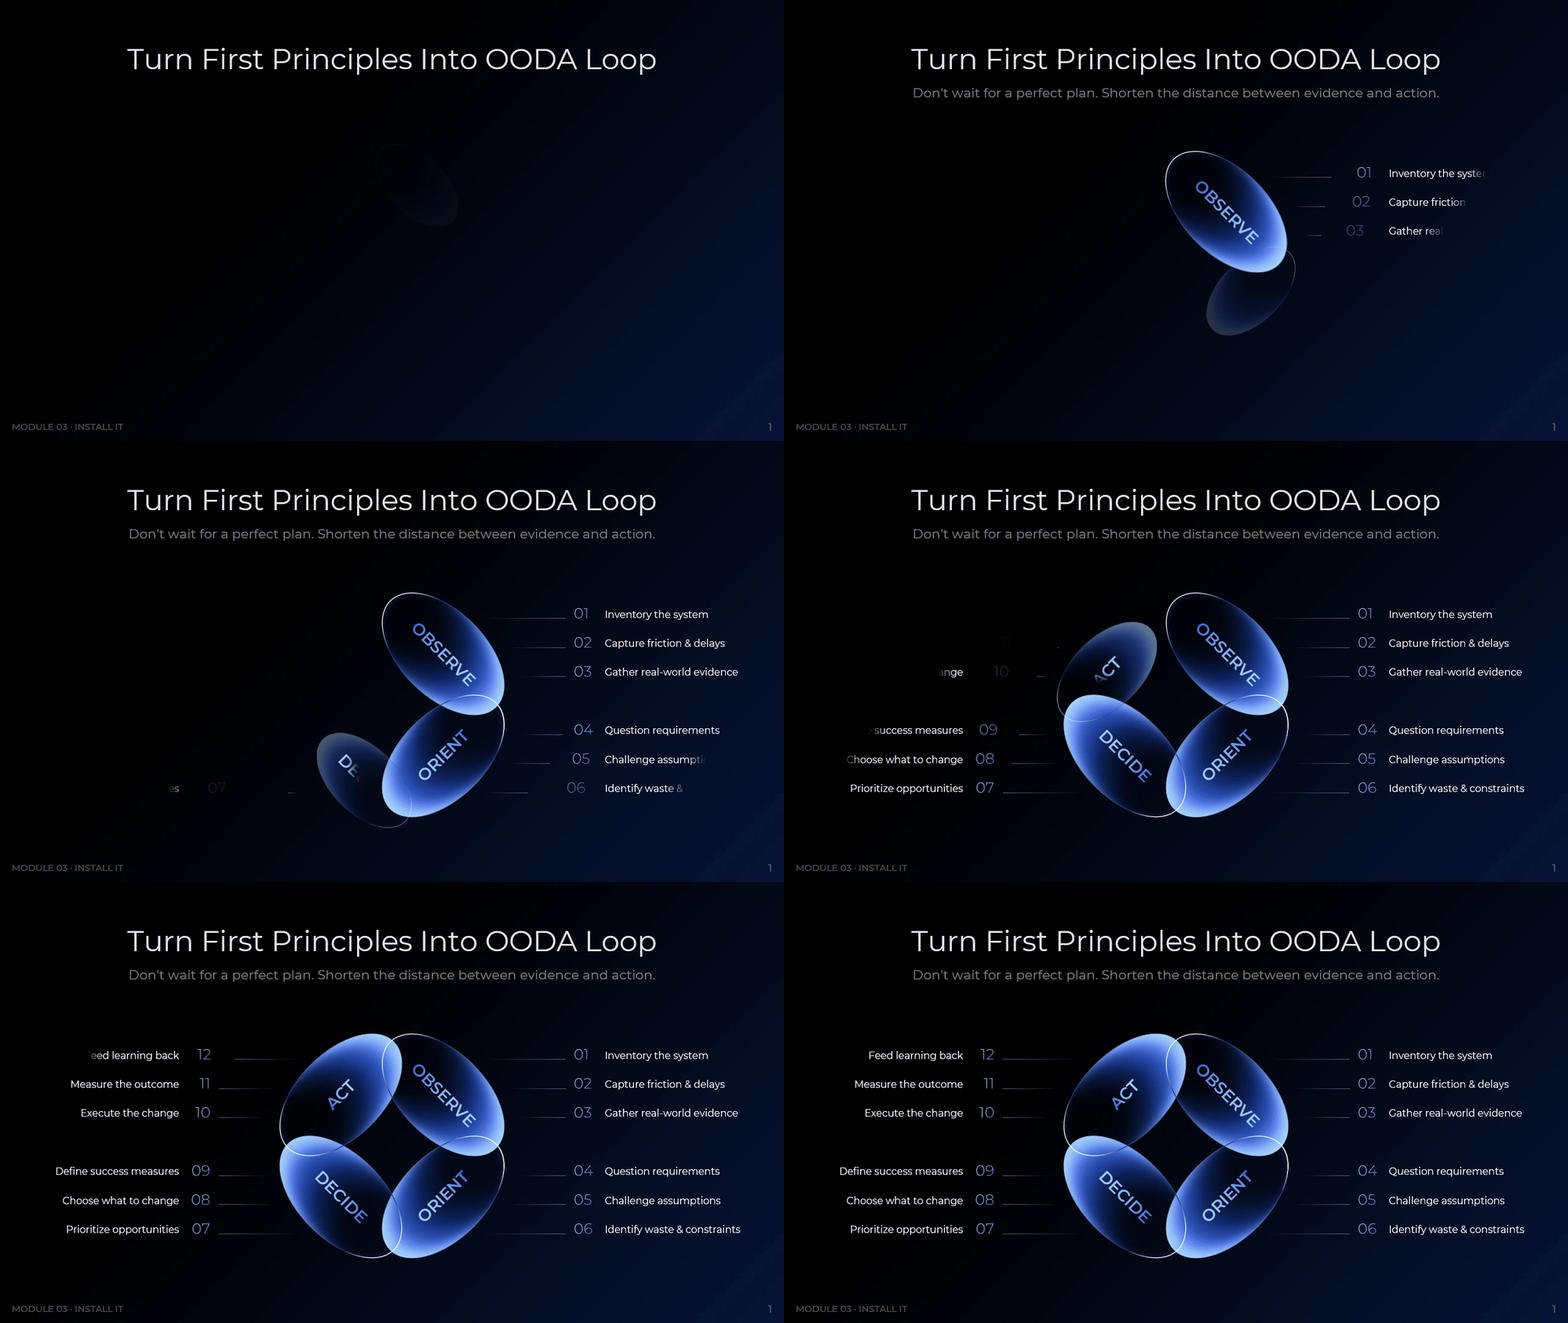
Analysis stalls without a cycle to feed it. This slide maps the method onto the OODA loop developed by United States Air Force Colonel John Boyd, arranged as twelve positions across observe, orient, decide, and act. The positions carry the practical work: inventory the system, capture friction, question requirements, choose what to change, execute, measure, and feed learning back. Teams should set an explicit loop length, monthly or quarterly, and treat measurement as a hard gate rather than an optional step.
The closing slide compresses the framework into six principles a manager can hold without notes: reason from physics, measure the hidden cost, delete before optimize, respect the sequence, put names on requirements, and make it a ritual. Each carries one supporting line. This is the slide to leave on screen at the end of a session and to reuse as the opening of the next review, since repetition is what moves a method into the way a department operates.

Cost, complexity, and speed are usually treated as three separate problems with three separate owners. This framework treats them as one problem with one root: assumptions that nobody has tested. First-principles reasoning finds the floor beneath an accepted price. The idiot index ranks where the gap between design and physics is widest. The algorithm supplies the order of operations that keeps effort away from work which should not exist. The deletion audit and the loop turn all of it into a cadence that survives a change of leadership. What emerges is not a cost-cutting exercise. It is an organization that knows the difference between a constraint set by nature and a constraint set by habit, and that difference compounds every year it is maintained.
Download presentation
The First Principles Operating System
PowerPoint
20 Slides
To continue, enter your email: