Slide of
데이터 스토리텔링 Presentation
빌딩 블록
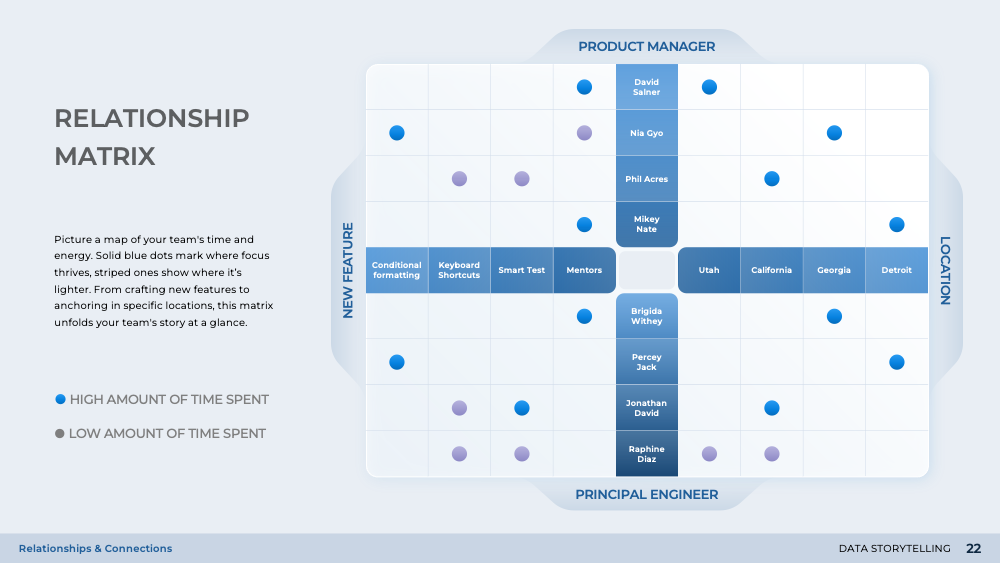
'데이터 스토리텔링' 프레젠테이션의 핵심 구성 요소인 '빌딩 블록' 슬라이드를 살펴보세요. 이 슬라이드는 복잡한 데이터를 소화하기 쉬운 세그먼트로 단순화하는 다섯 가지 방식의 인포그래픽을 사용합니다. 이는 관람자가 다양한 데이터 포인트 간의 관계와 연결성을 이해하는 데 도움을 줍니다. 다이어그램의 사용은 데이터 스토리의 기여 요소를 시각화하는 데 더욱 도움이 됩니다. 이 슬라이드는 통계적 복잡성을 해독하고 비즈니스 예지력을 향상시키는 시각적 도구의 힘을 입증하는 것입니다.
Download & customize
데이터 스토리텔링
PowerPoint
28 Slides


Join You Exec
Access the full library of business templates

Get full access
Quarterly
Yearly
Three years
[[-PAYWALL_PSQ_PRICE_MONTHLY_DISCOUNTED_FORMATTED-]]
per month
Billed quarterly
that's $3 per template
Join Plus[[-PAYWALL_PSY_PRICE_MONTHLY_DISCOUNTED_FORMATTED-]]
per month
Billed yearly
that's $2 per template
Join Plus[[-PAYWALL_P3Y_PRICE_MONTHLY_DISCOUNTED_FORMATTED-]]
per month
Billed every 3 years
that's $2 per template
Join Plus
Try for free
Download our free templates each week
No credit card required
OR
Already have an account?
Log in
Preview
Full preview (28 Slides)