Sales
Startups
Productivity
Presentations
Spreadsheets
Book Summaries
Operations
Management
Human Resources
Project Management
Strategy
Marketing

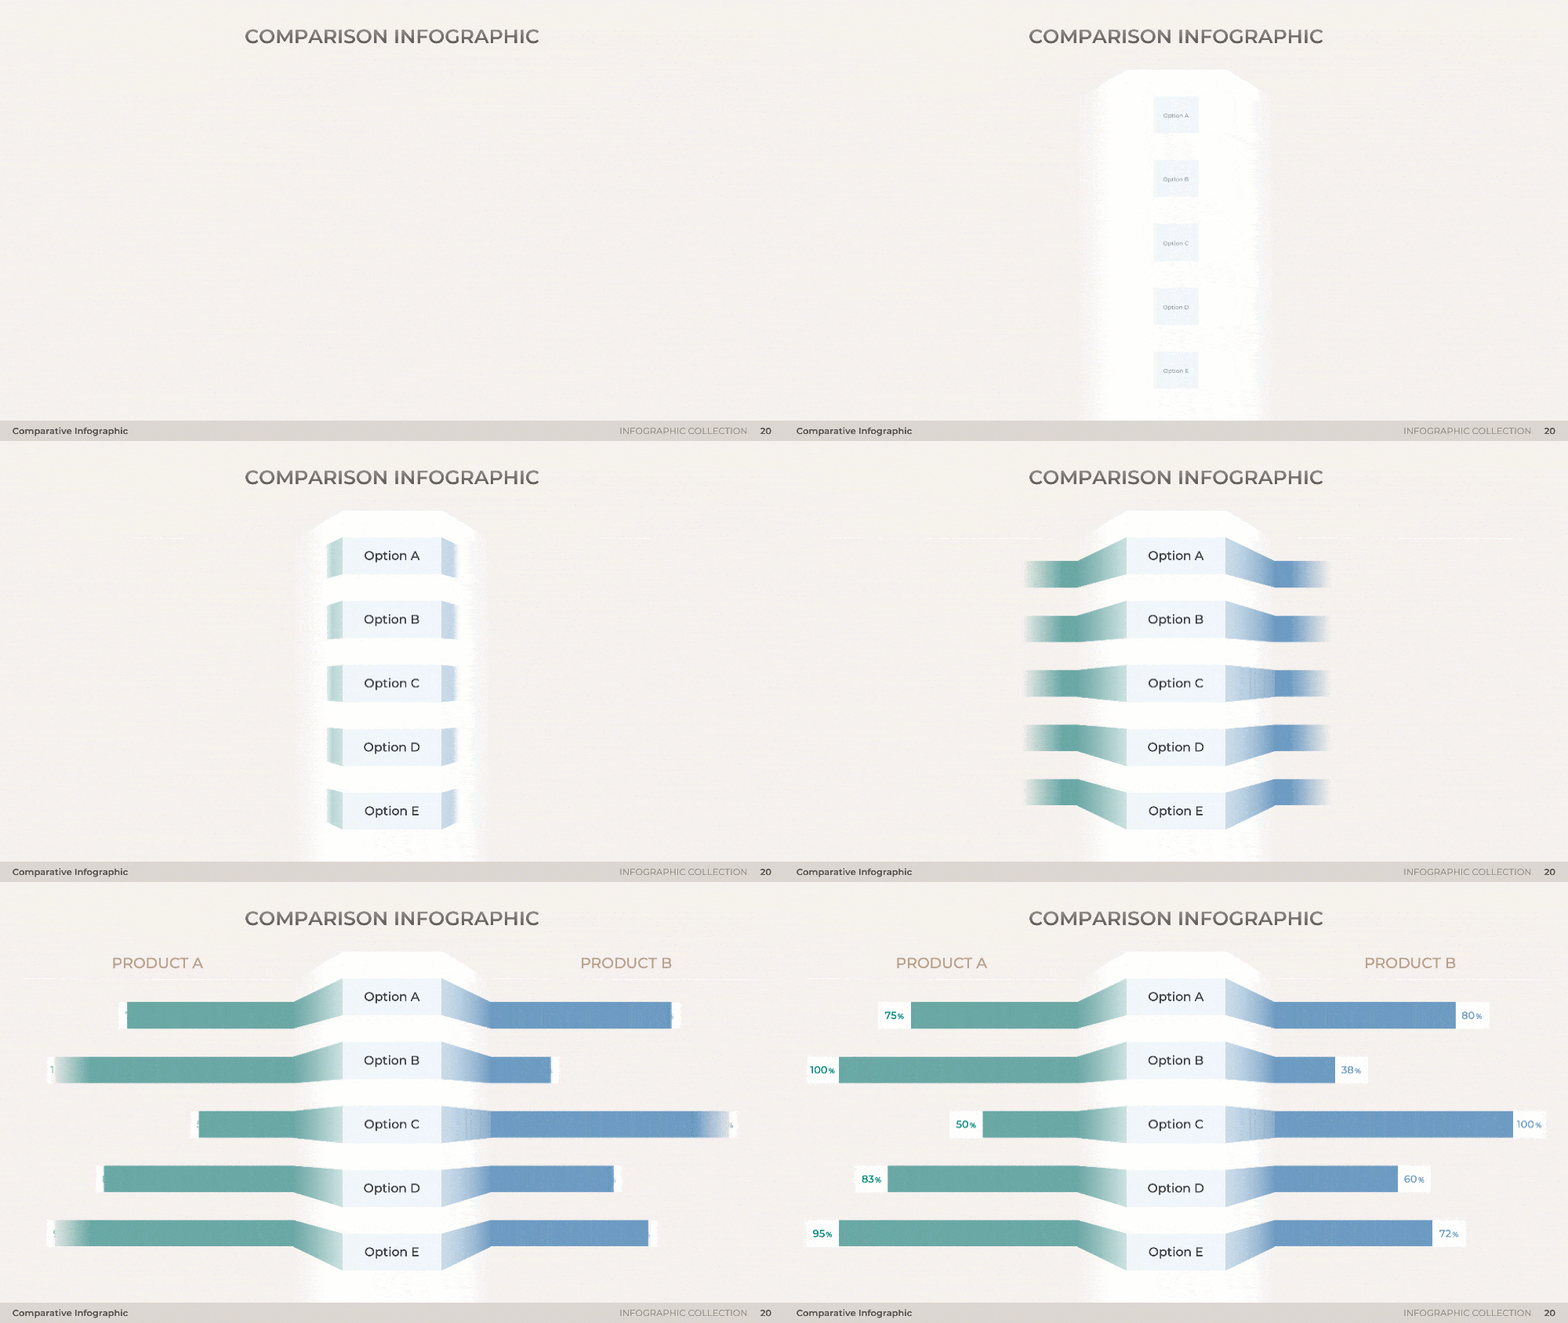
Comparison Infographic

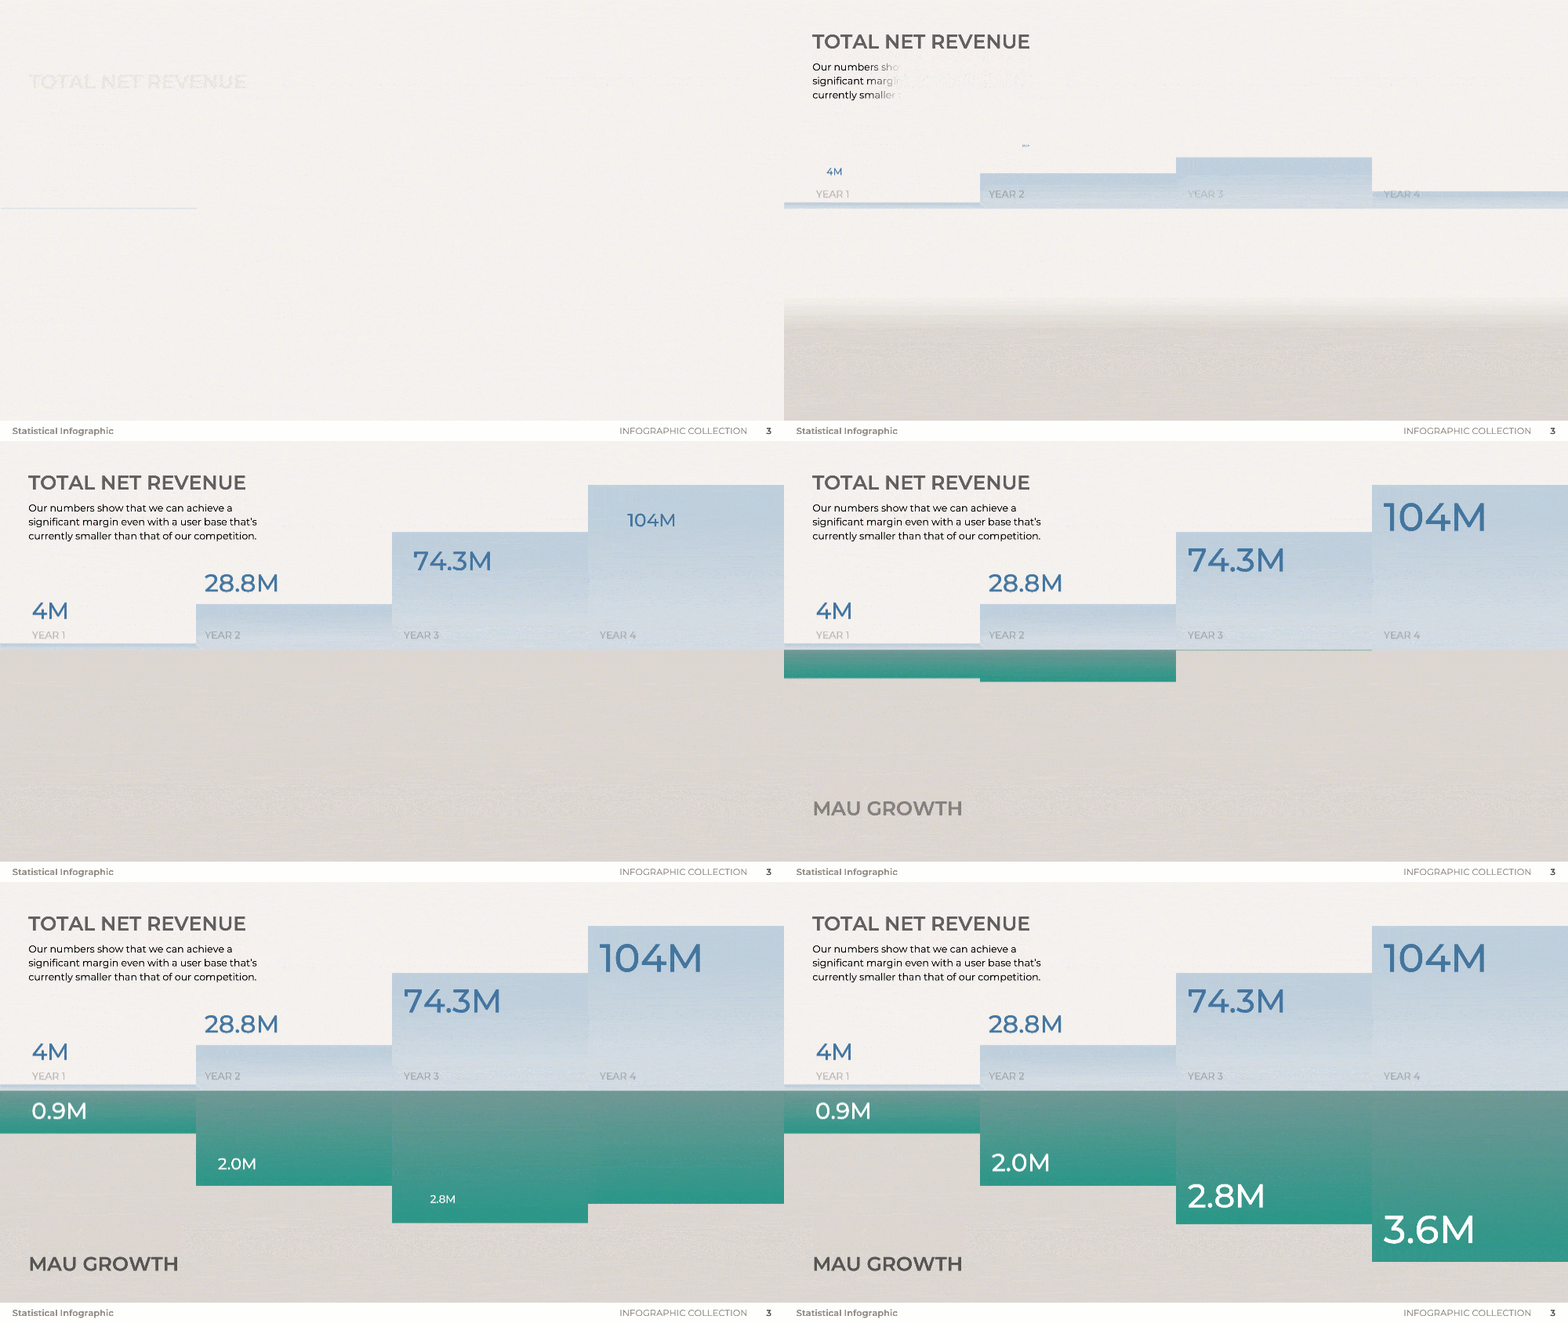
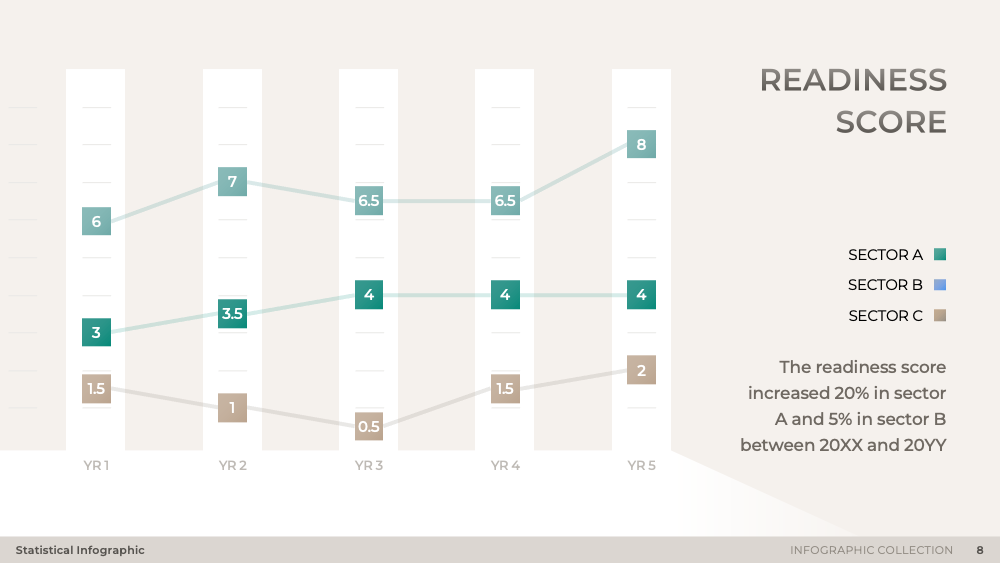
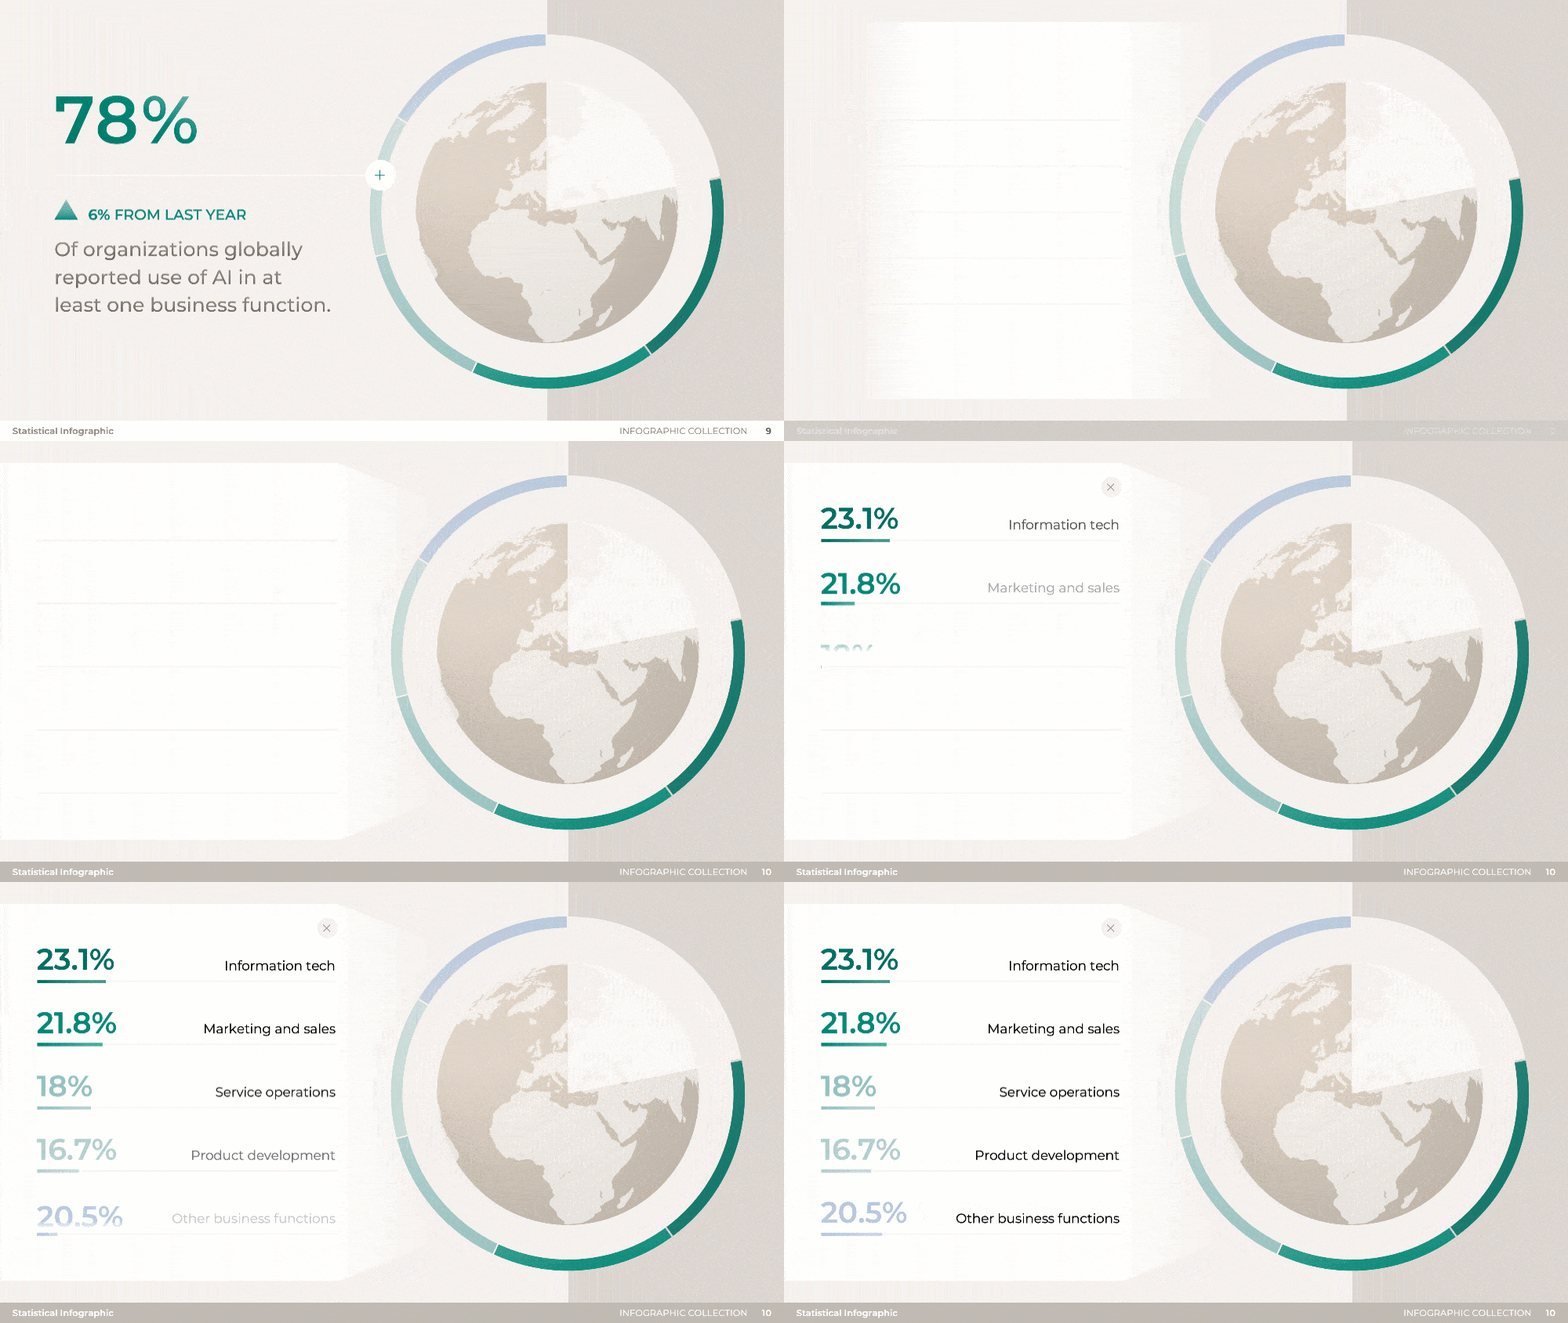
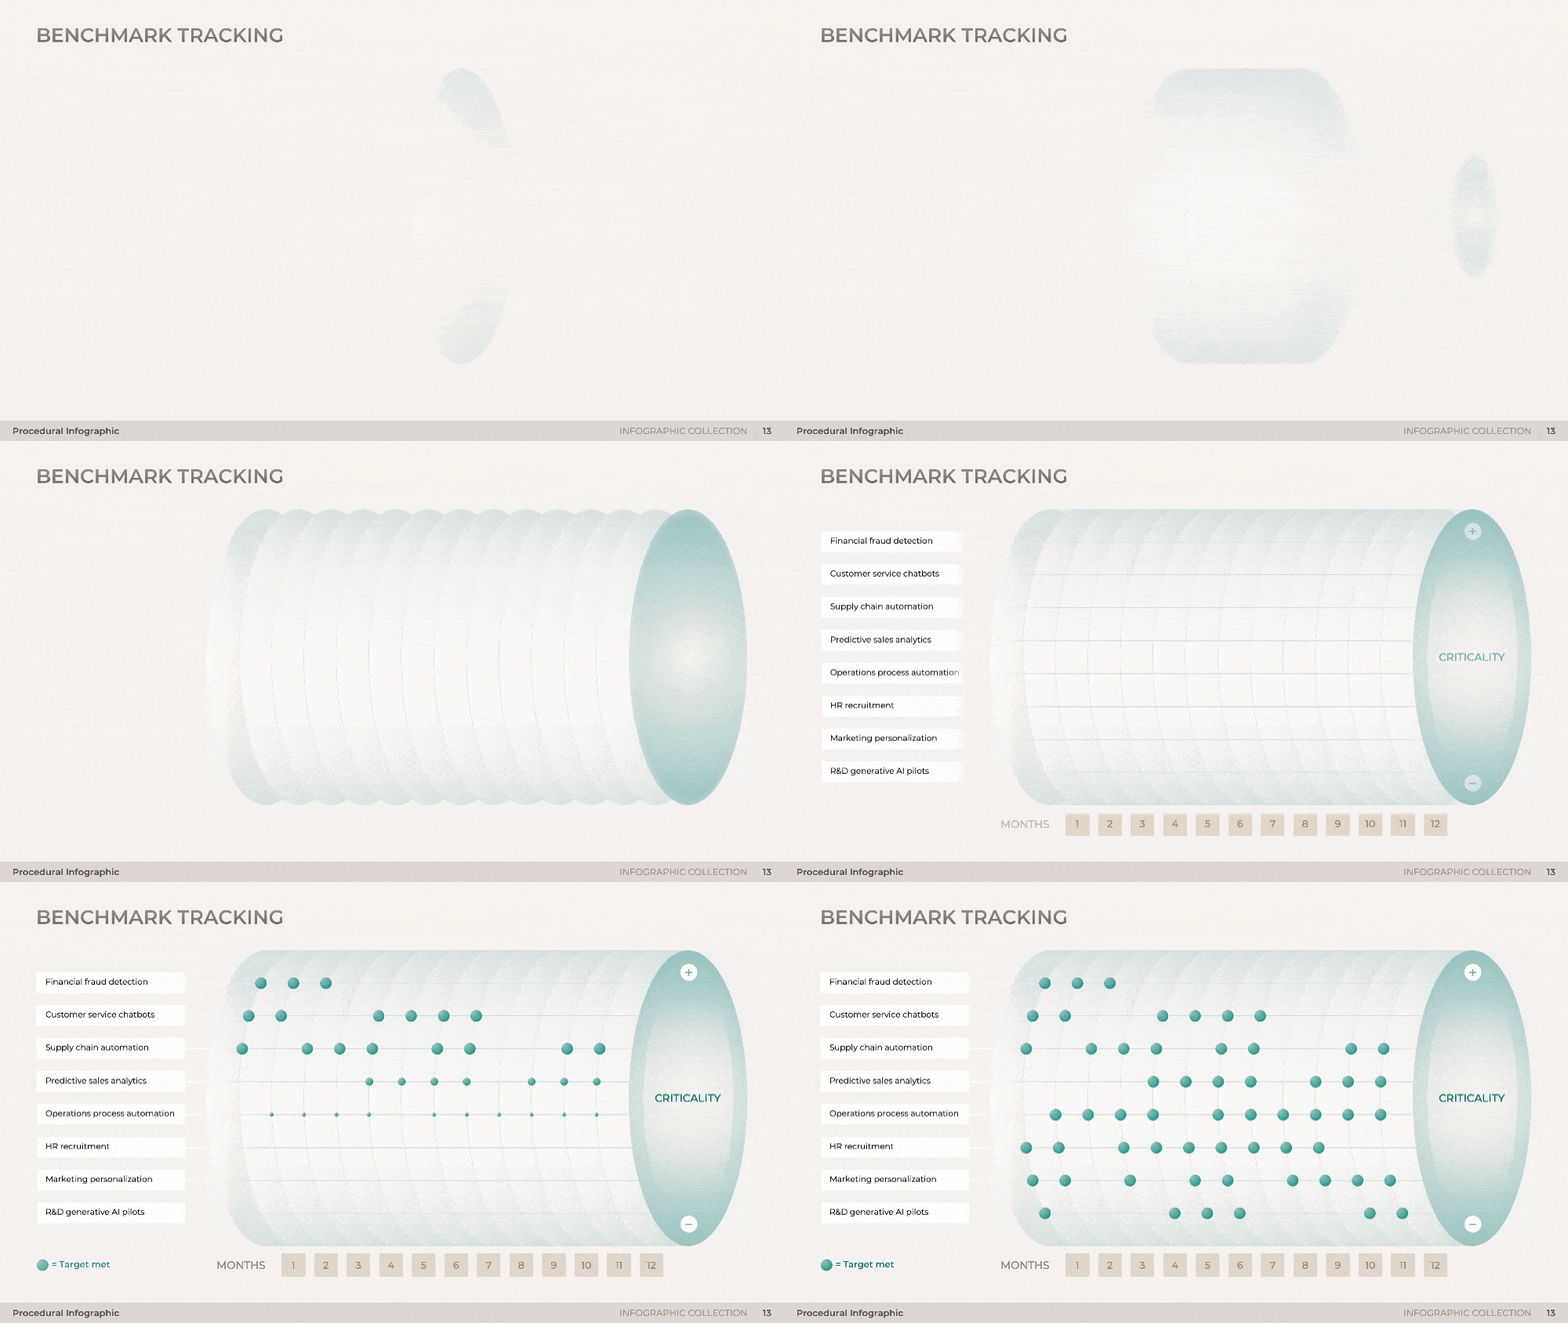
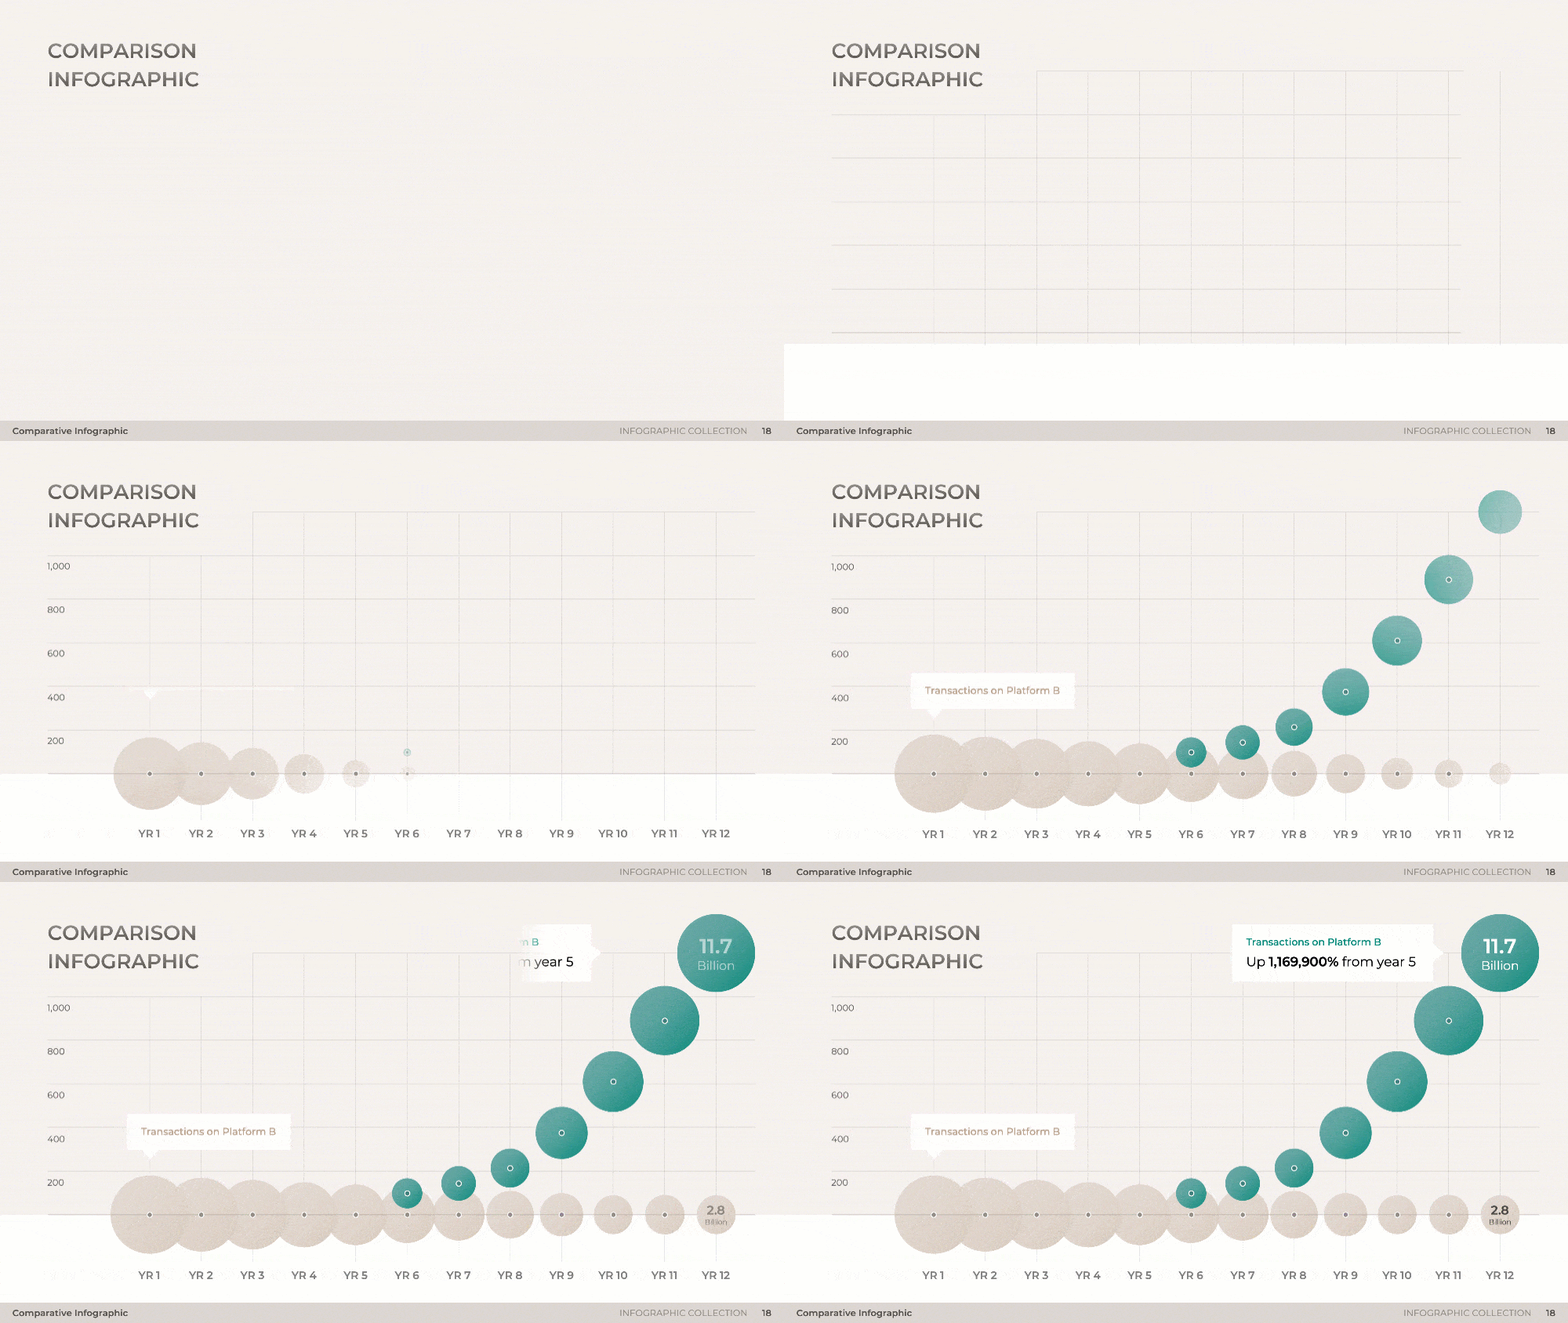
Unleashing the power of visualization, the 'Comparison Infographic' slide in the 'Infographic Collection' presentation is a creative tool for presenting comparative data. It uses pictorial graphs and percentage charts to simplify complex data, making it easy for viewers to grasp the information. This slide is particularly useful for showcasing patterns and insights, transforming raw metrics into compelling narratives that drive conviction.

Download slide

Infographic Collection

PowerPoint

25 Slides

To continue, enter your email:

OR
Already have an account? Log in

Preview
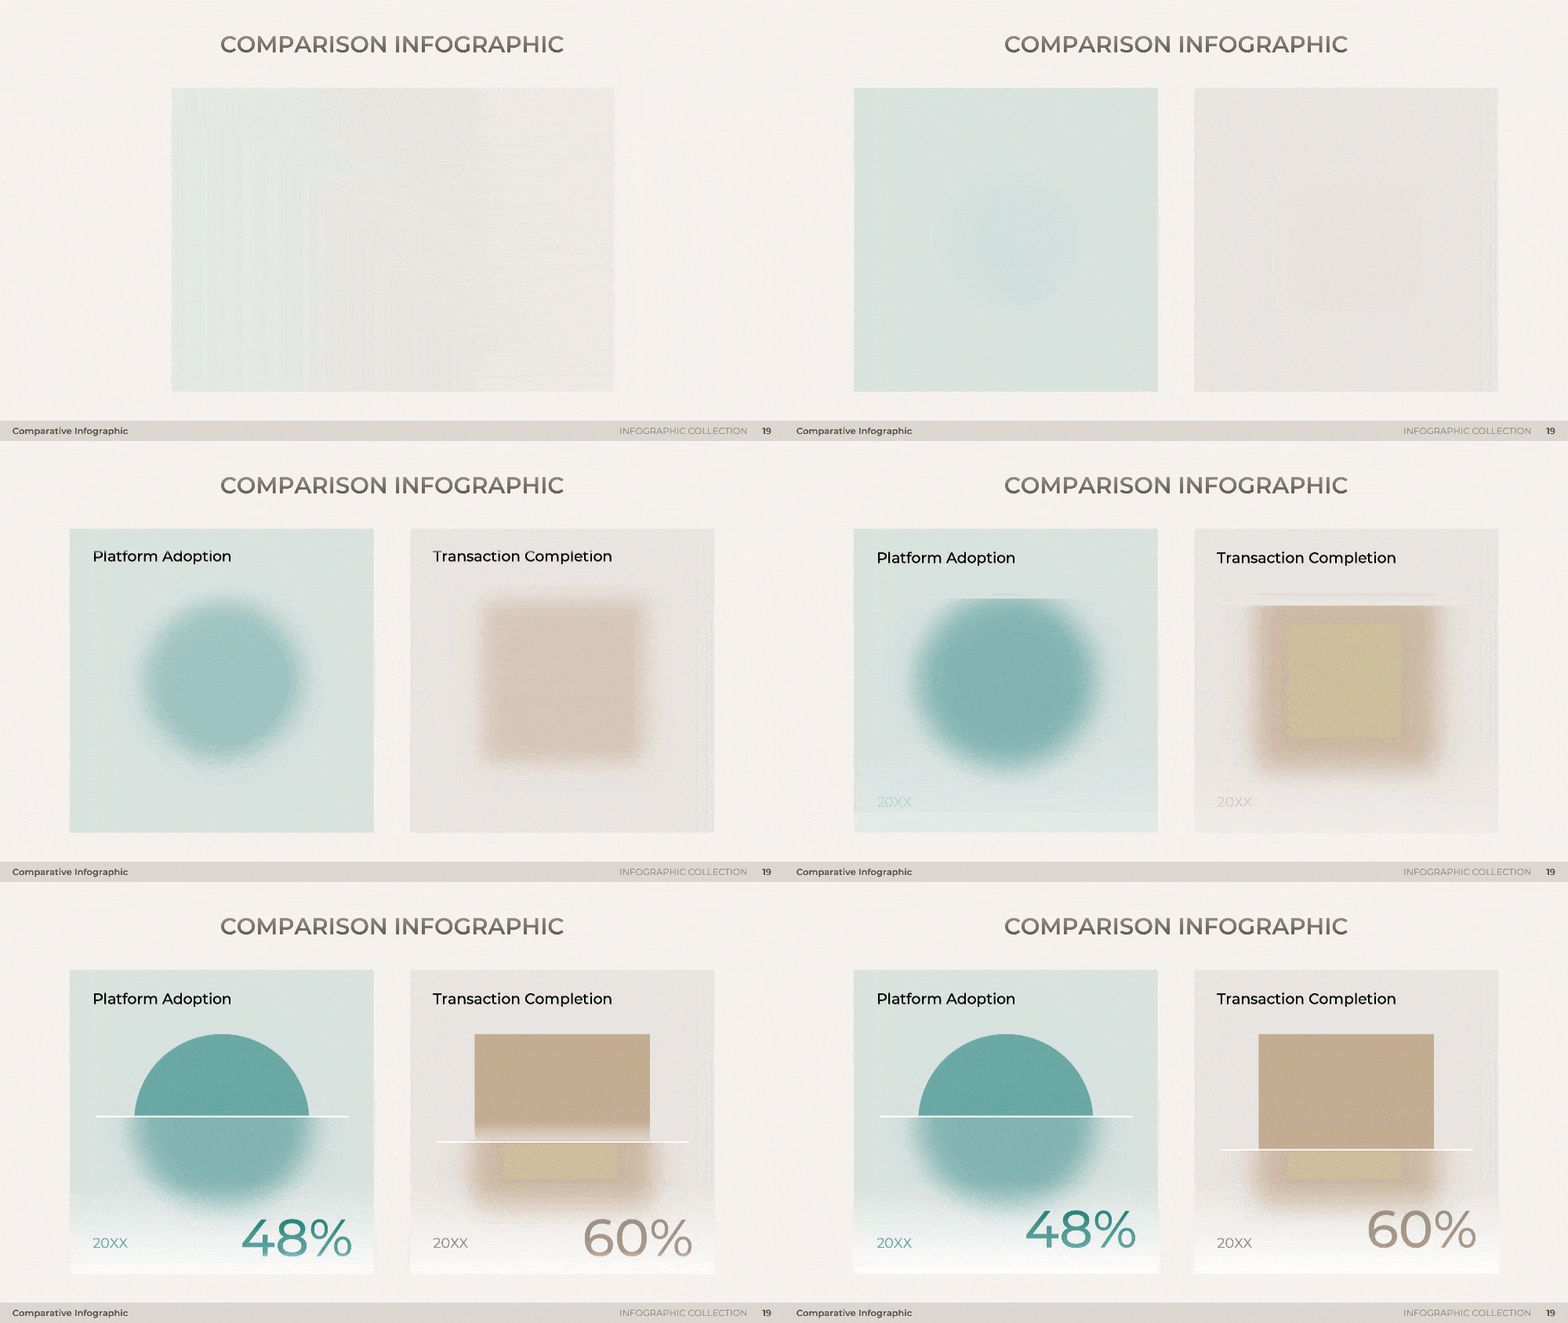
Comparison Infographic Slide preview

Full preview (25 Slides)

s

Title Slide preview
Statistical Infographic Slide preview
Procedural Infographic Slide preview
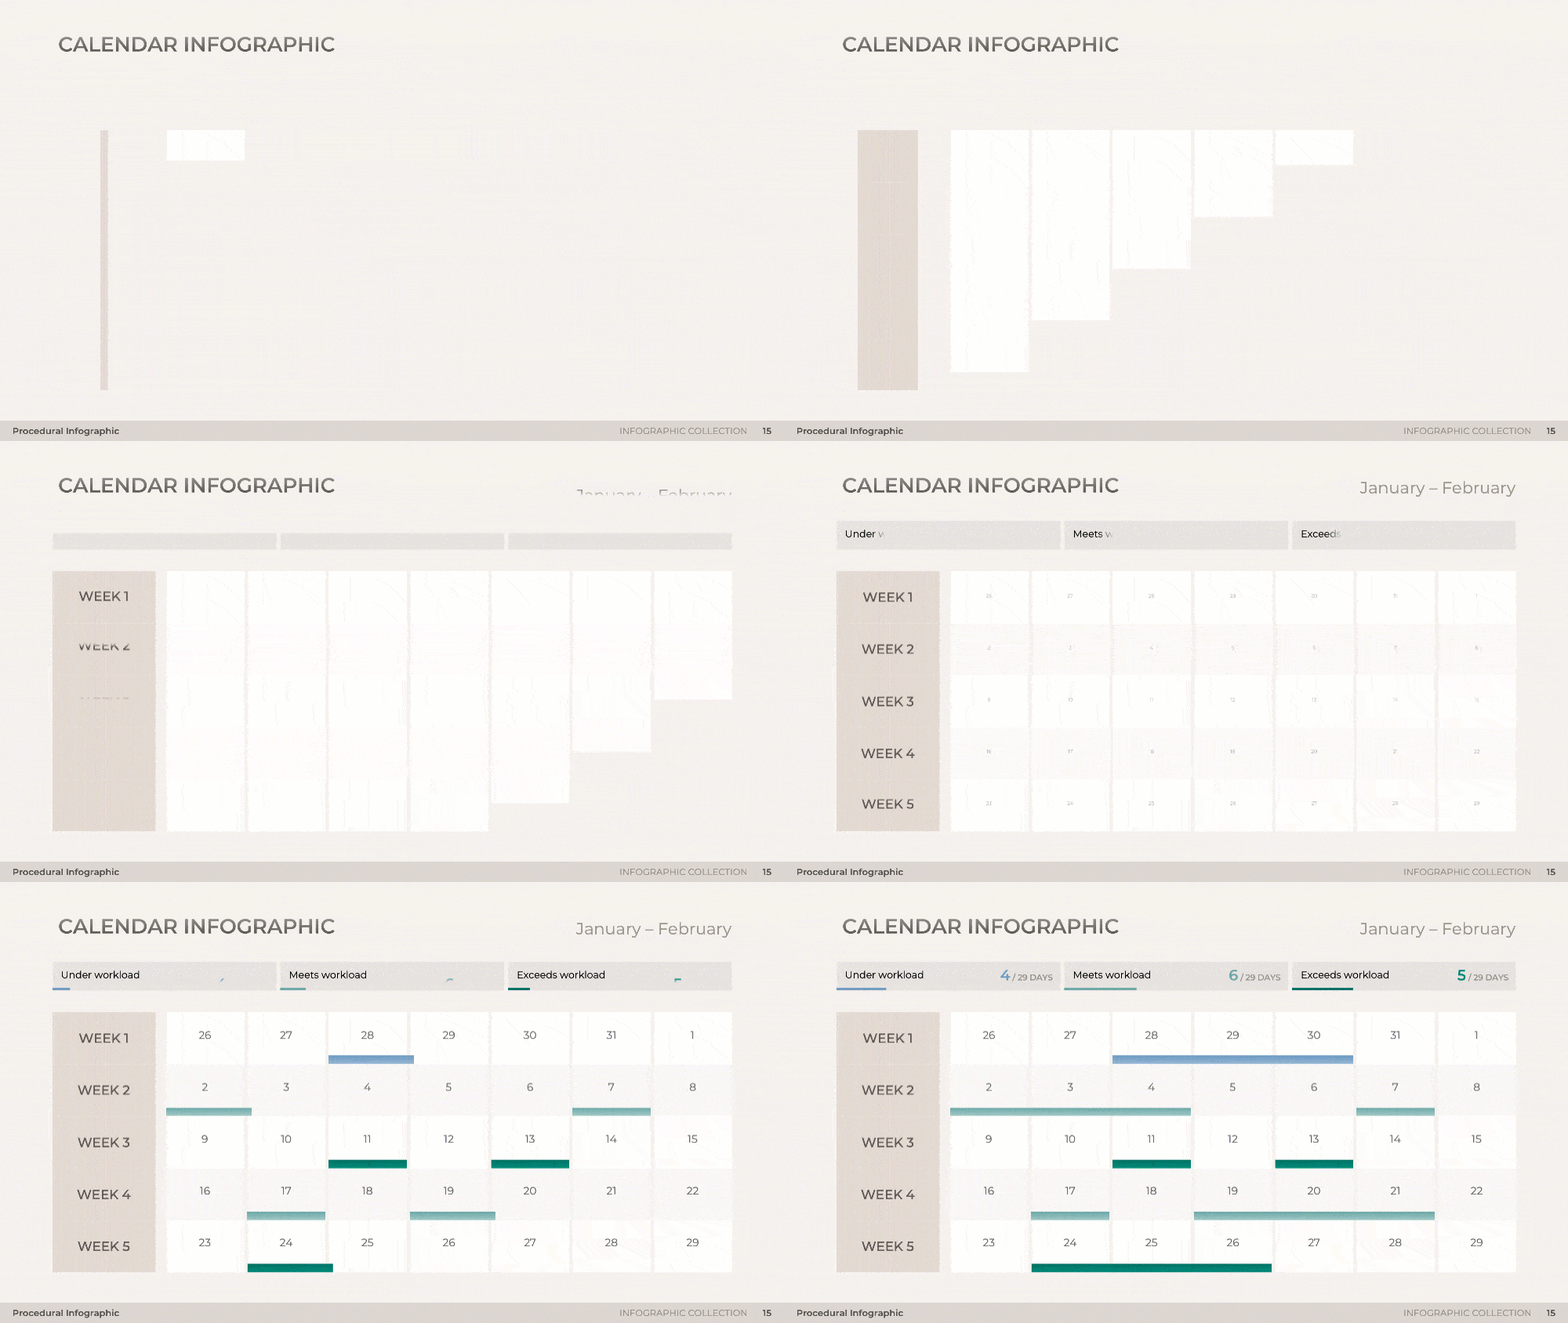
Calendar Infographic Slide preview
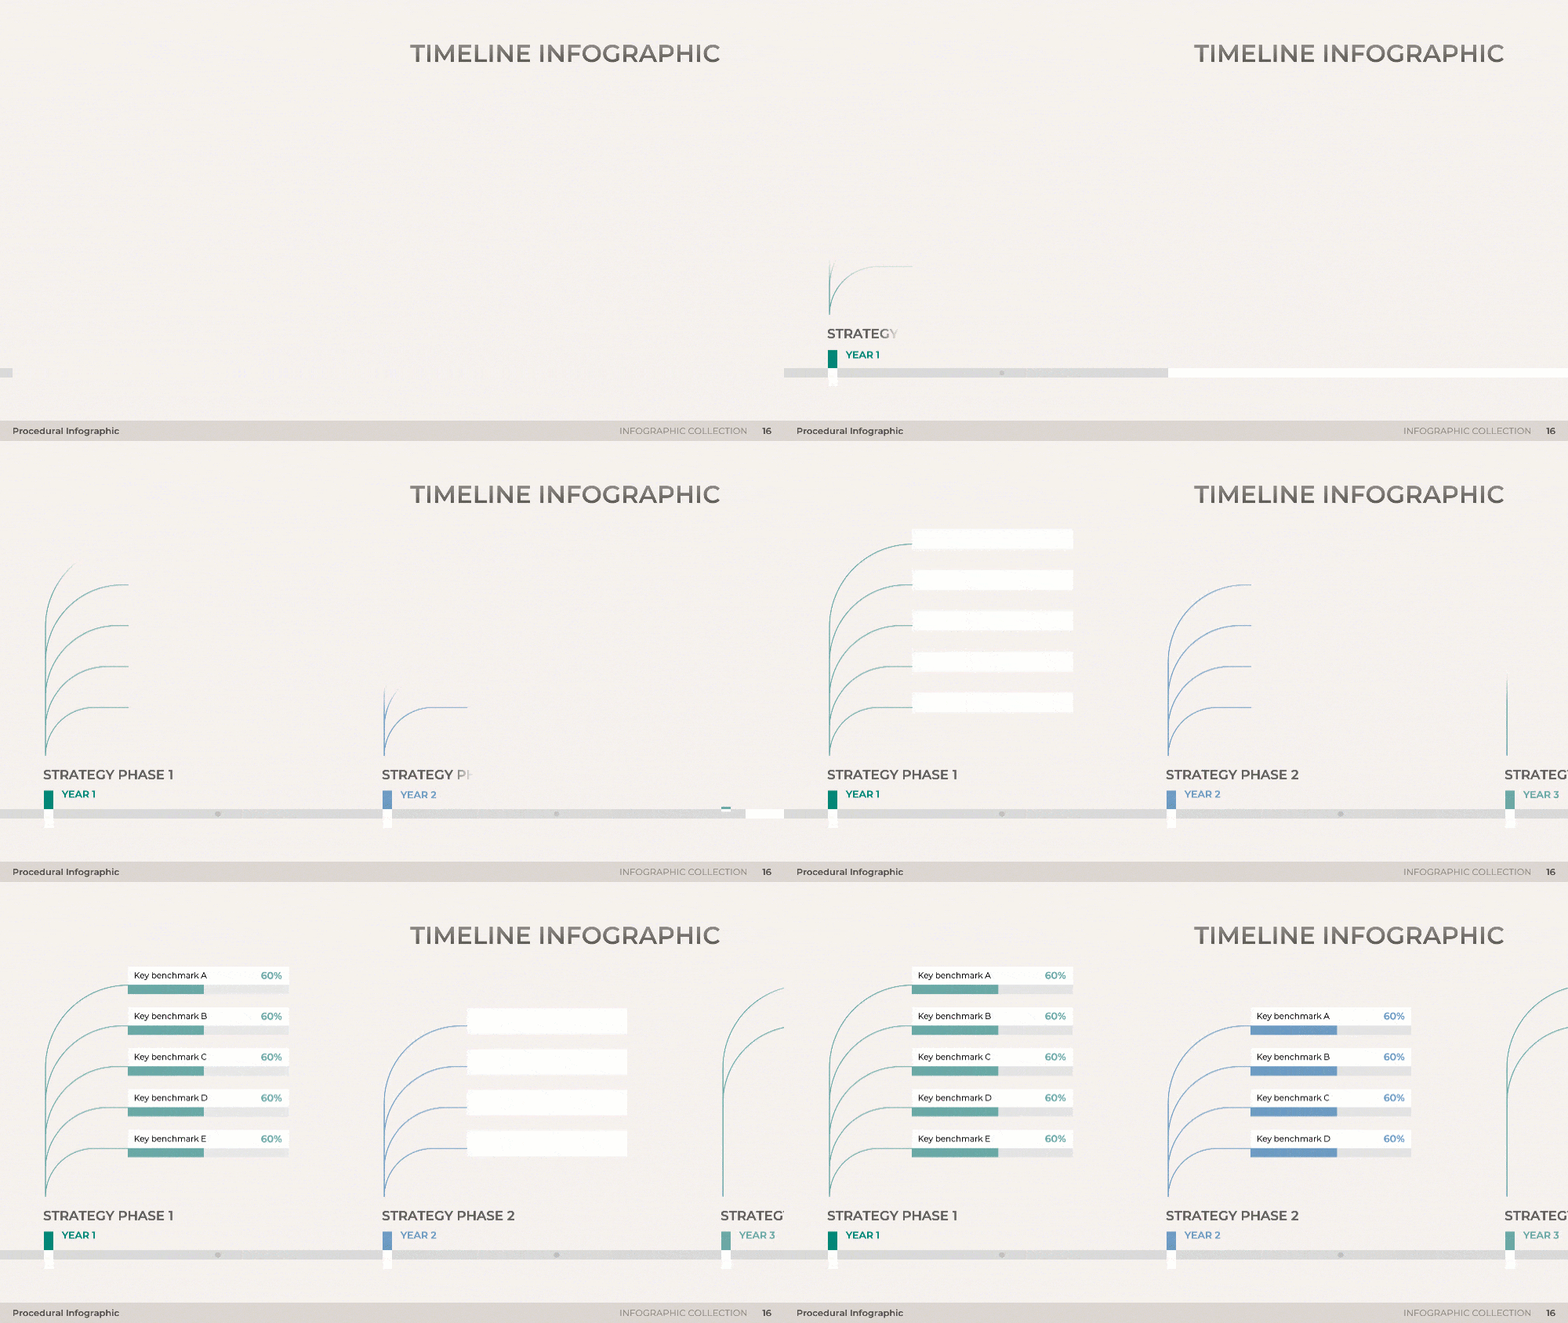
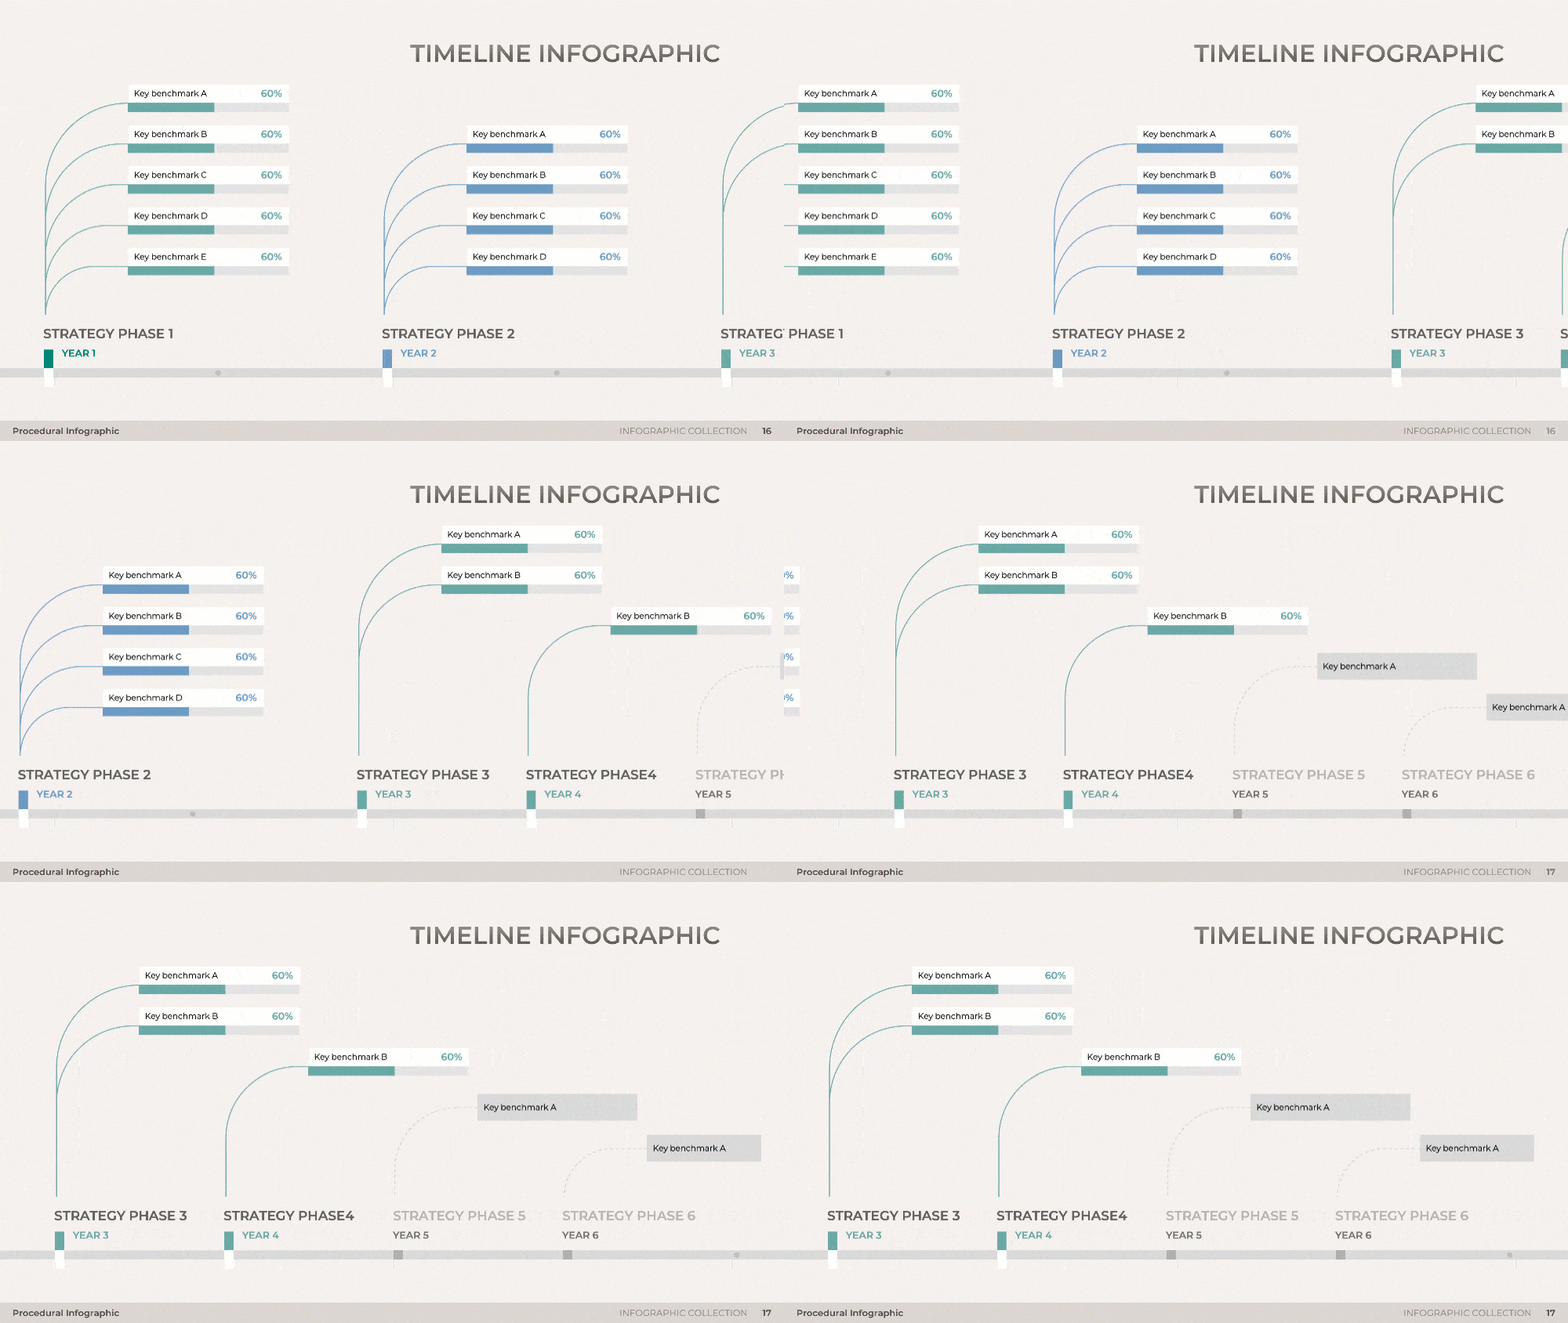
Timeline Infographic Slide preview
Comparison Infographic Slide preview
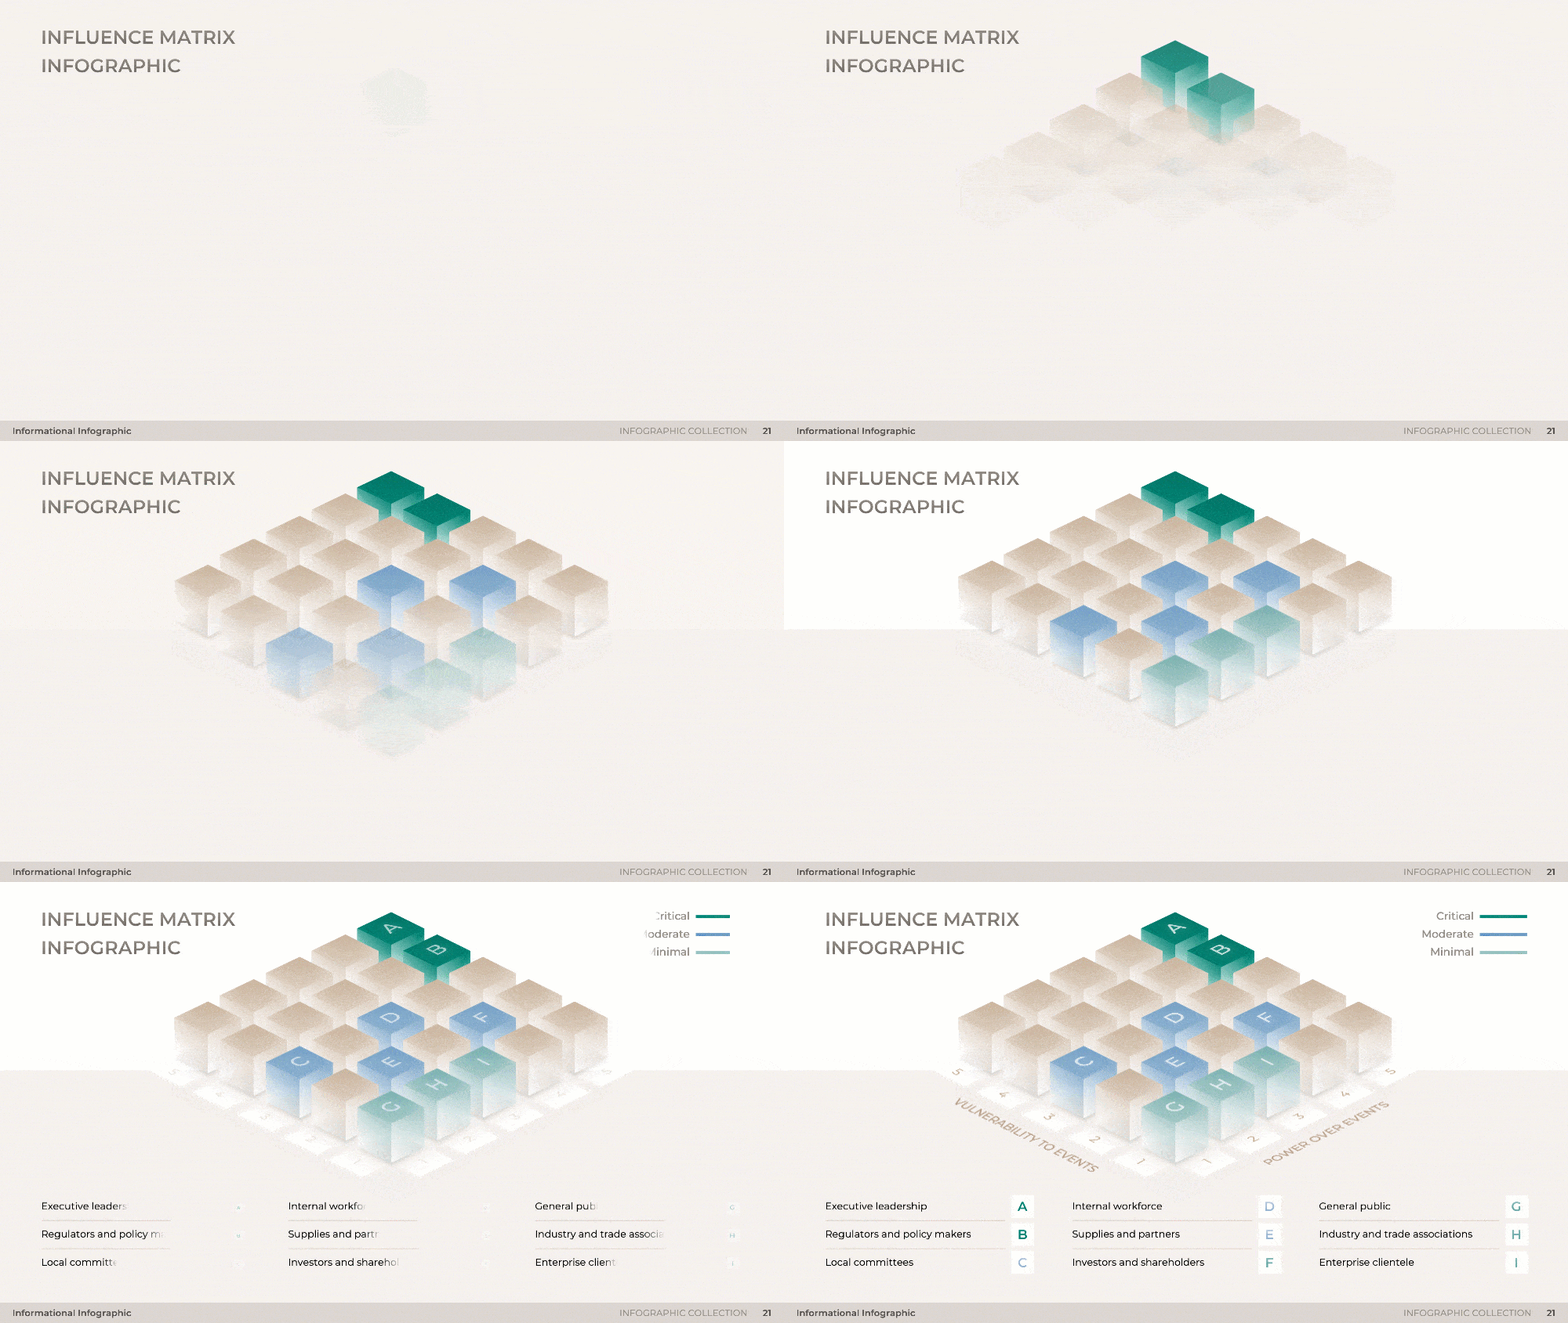
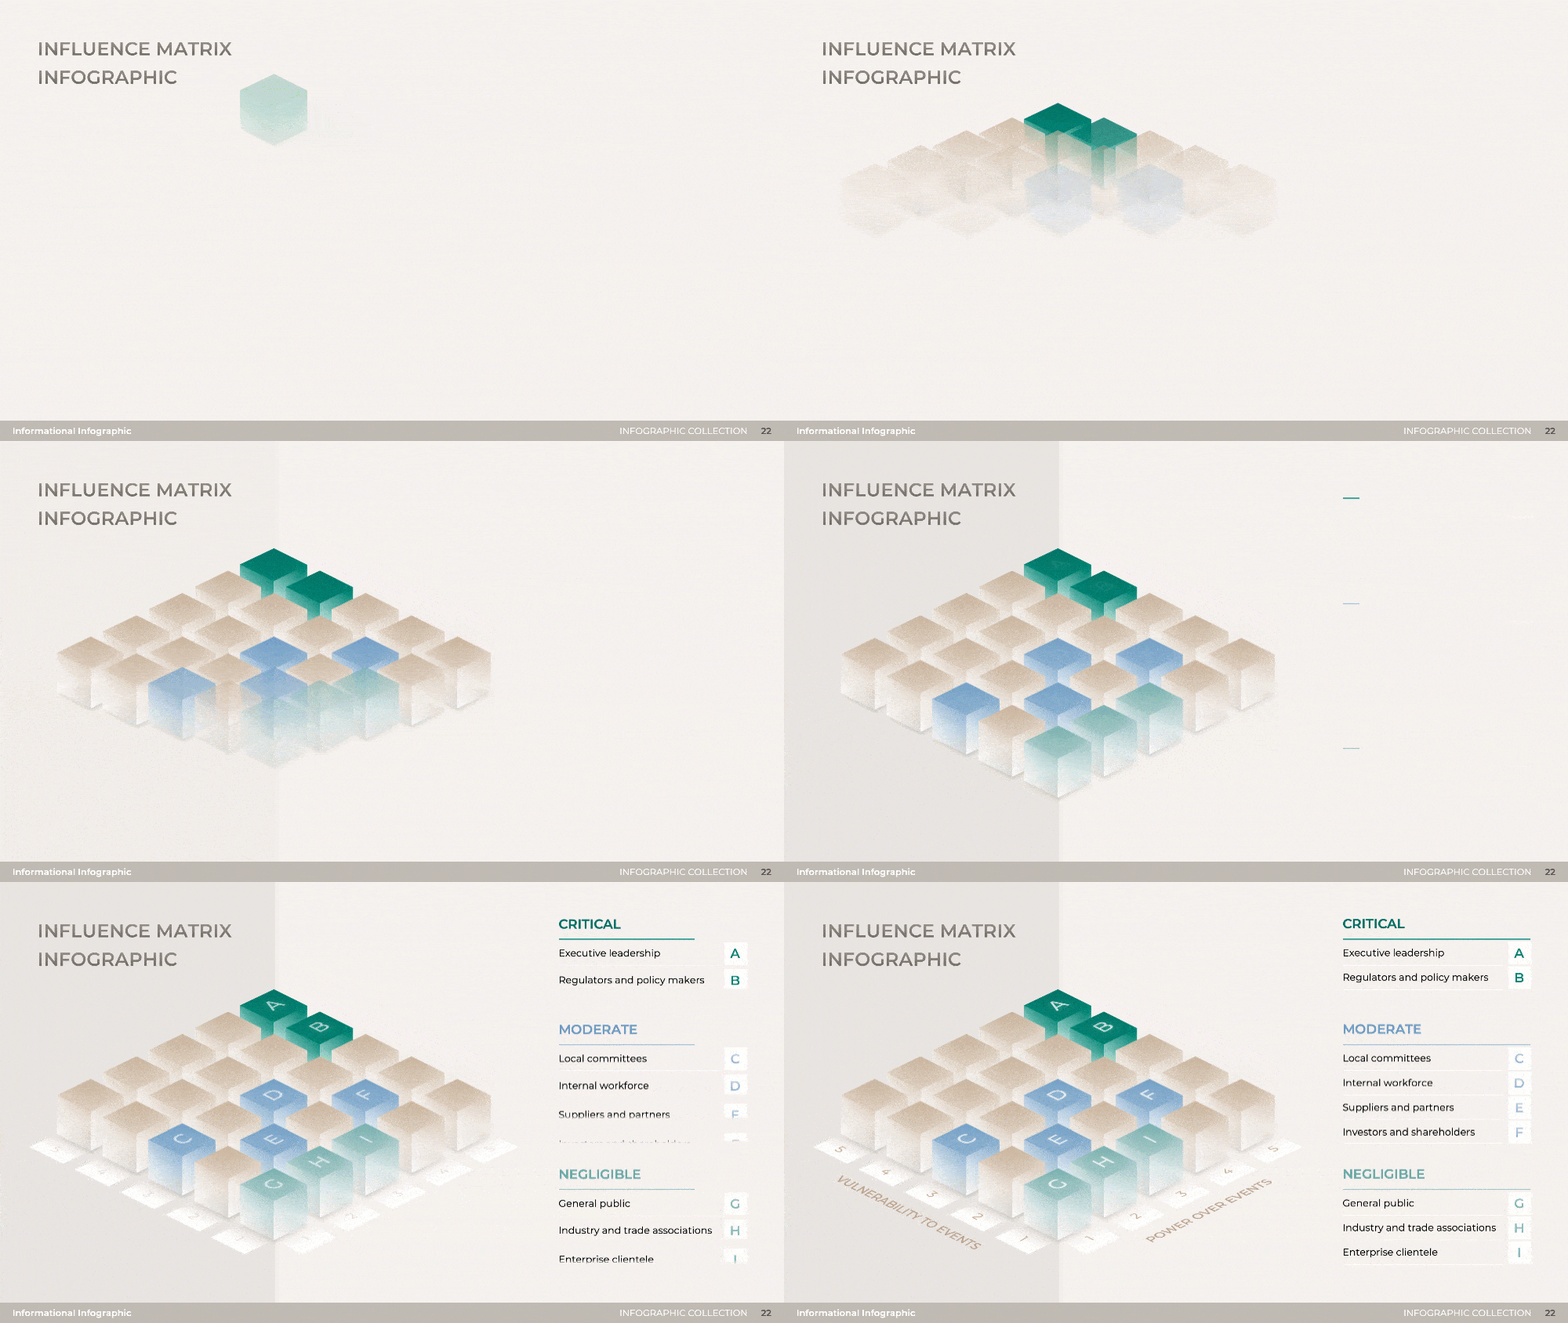
Informational Infographic Slide preview
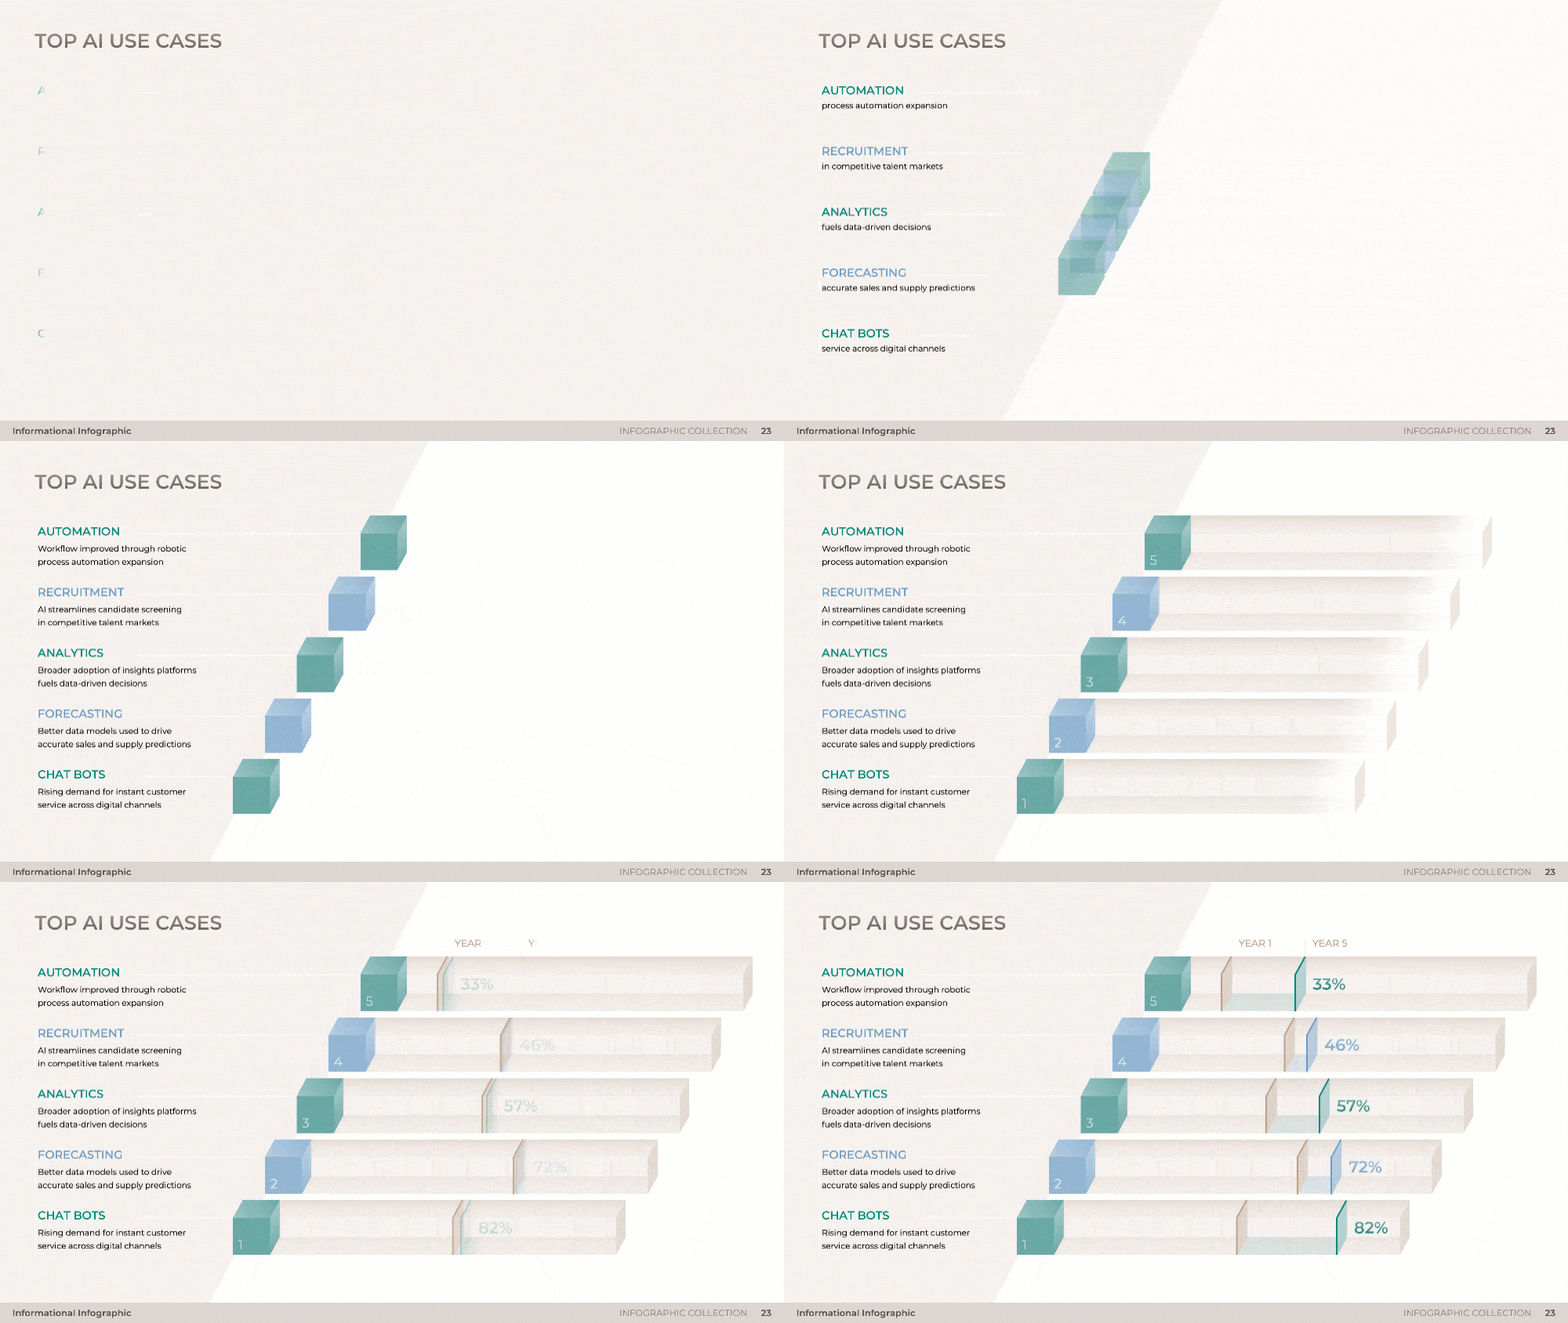
Ranking Infographic Slide preview
Four-Node Infographic Slide preview
Five-Node Diagram Slide preview
Pyramid Diagram Slide preview
Infographic Collection Presentation preview

Trusted by top partners