Slide of
Infographic Collection Presentation
Comparison Infographic
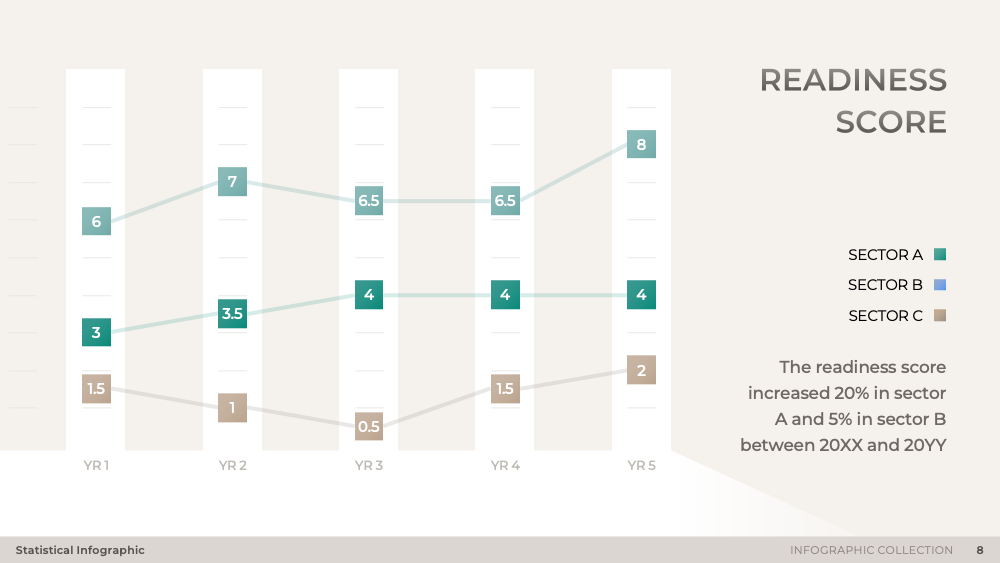
Brimming with impactful visuals, the 'Comparison Infographic' slide offers a unique blend of bidirectional bar graphs and butterfly charts. It's designed to simplify complex data, making it easier for the audience to grasp comparative statistics. Its horizontal bar chart layout further enables a clear, side-by-side comparison of different data sets. This slide is a part of our 'Infographic Collection', a resource dedicated to transforming raw content and metrics into insightful narratives.
Download & customize
Infographic Collection
PowerPoint
25 Slides


Join You Exec
Access the full library of business templates

Get full access
[[-PAYWALL_PSQ_PRICE_MONTHLY_DISCOUNTED_FORMATTED-]]
per month
Billed quarterly
that's $3 per template
Join Plus[[-PAYWALL_PSY_PRICE_MONTHLY_DISCOUNTED_FORMATTED-]]
per month
Billed yearly
that's $2 per template
Join Plus[[-PAYWALL_P3Y_PRICE_MONTHLY_DISCOUNTED_FORMATTED-]]
per month
Billed every 3 years
that's $2 per template
Join Plus
Try for free
Download our free templates each week
No credit card required
Preview
Full preview (25 Slides)