Slide of
डेटा कथाकथन Presentation
कॉर्पोरेट प्रदर्शन
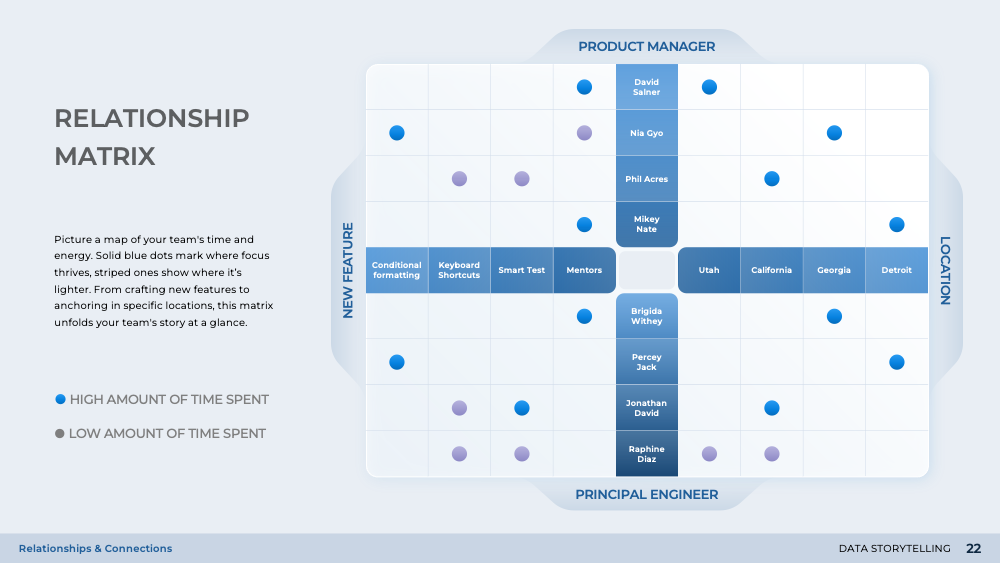
कॉर्पोरेट प्रदर्शन के क्षेत्र में गहराई से जाने, यह स्लाइड बेंचमार्किंग और प्रदर्शन स्तरों का व्यापक दृश्य प्रदान करता है। यह एक हीट मैप और इंटेंसिटी टेबल का उपयोग करके टीम के प्रदर्शन को विजुअली प्रस्तुत करता है, औसत से ऊपर और नीचे के प्रदर्शनों में अंतर करता है। यह स्लाइड, 'डाटा स्टोरीटेलिंग' प्रस्तुति का हिस्सा, जटिल सांख्यिकीय डेटा की समझ को सरल करने के लिए डिज़ाइन किया गया है, इसे दर्शकों के लिए अधिक सुलभ बनाता है। यह नयाँपन और सांख्यिकीय जटिलता को डिकोड करने वाले निरीक्षणों को उजागर करके व्यापारिक दूरदर्शिता को तेज करने में मदद करता है।
Download slide
डेटा कथाकथन
PowerPoint
28 Slides
To continue, enter your email:
OR
Already have an account?
Log in
Preview

Full preview (28 Slides)