Slide of
데이터 스토리텔링 Presentation
기업 성과
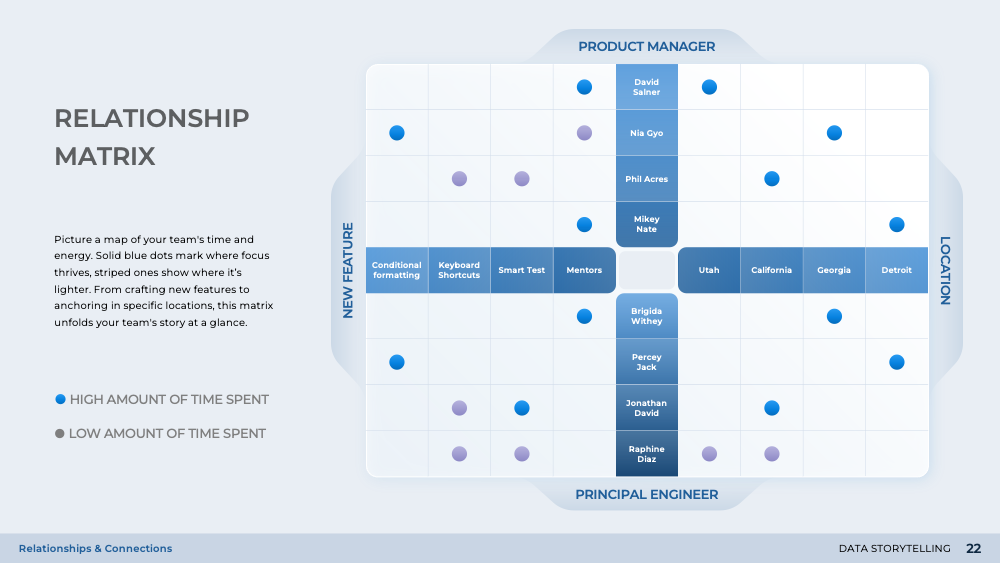
기업 성과의 영역에 깊이 들어가, 이 슬라이드는 벤치마킹과 성과 수준에 대한 포괄적인 시각을 제공합니다. 히트맵과 강도 표를 사용하여 팀 성과를 시각적으로 나타내며, 평균 이상과 평균 이하의 성과를 구분합니다. 이 슬라이드는 '데이터 스토리텔링' 프레젠테이션의 일부로, 복잡한 통계 데이터의 이해를 단순화하여 관객에게 더 접근하기 쉽게 만드는 것이 목표입니다. 또한, 미묘한 관찰을 발견하고 통계적 복잡성을 해독함으로써 비즈니스 예지력을 더욱 선명하게 만드는 데 도움이 됩니다.
Download slide
데이터 스토리텔링
PowerPoint
28 Slides
To continue, enter your email:
OR
Already have an account?
Log in
Preview

Full preview (28 Slides)