Slide of
KPI Dashboards (Part 1) Presentation
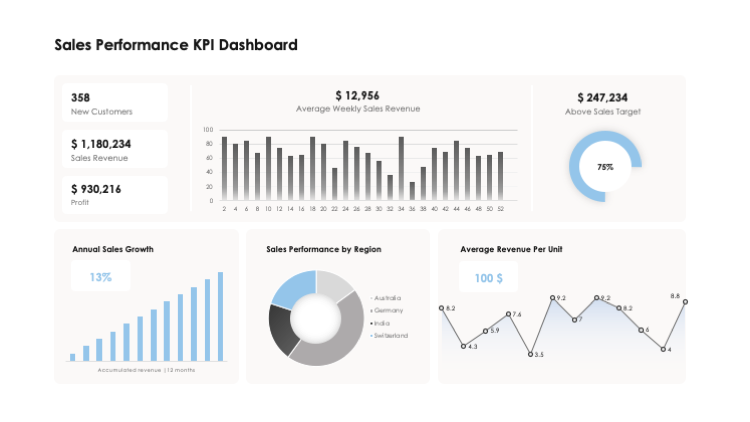
Financial Performance Dashboard
Delving into the essence of financial health, the 'Financial Performance Dashboard' slide in the 'KPI Dashboards (Part 1)' covers key indices valuable to decipher the performance of an organization. It crisply visualizes metrics like net sales, gross margin, operating profit and more. With a focus on profitability, liquidity, and leverage, it empowers a comprehensive understanding of fiscal stability. It also sheds light on sales performance, ultimately serving as a convenient and intuitive reality check for all who turn to it.
Download slide
KPI Dashboards (Part 1)
PowerPoint
30 Slides
KPI Dashboards (Part 1)
Apple Keynote
30 Slides
To continue, enter your email:
OR
Already have an account?
Log in
Preview

Full preview (30 Slides)
s