Slide of
KPI Dashboards (Part 1) Presentation
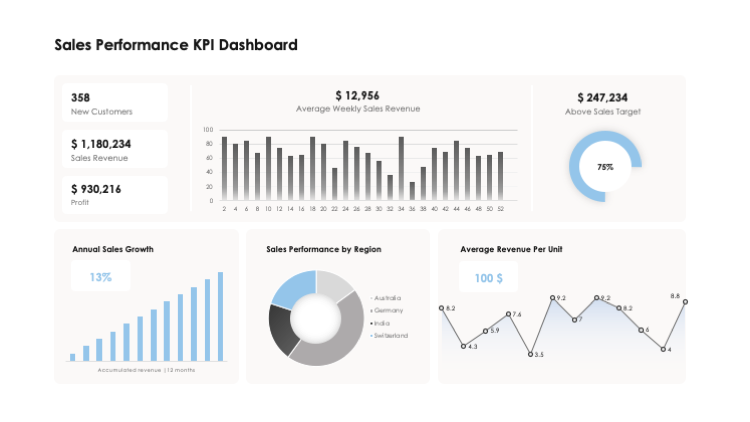
Financial Revenue & Expense KPI Dashboard
Delving into the depths of financial understanding, this slide titled 'Financial Revenue & Expense KPI Dashboard' serves as a potent guide. It is part of the 'KPI Dashboards (Part 1)', collection which aims to communicate and measure goals across various sectors. This specific slide focuses on financial performance metrics, including revenue by region, marketing expenses, general & admin costs, sales expenses, and financial expenses and revenue. It's constructed to present complex financial data in a user-friendly way, ideal for students exploring finance or managers seeking simplified financial insights.
Download slide
KPI Dashboards (Part 1)
PowerPoint
30 Slides
KPI Dashboards (Part 1)
Apple Keynote
30 Slides
To continue, enter your email:
OR
Already have an account?
Log in
Preview

Full preview (30 Slides)