Slide of
Project Proposal Presentation
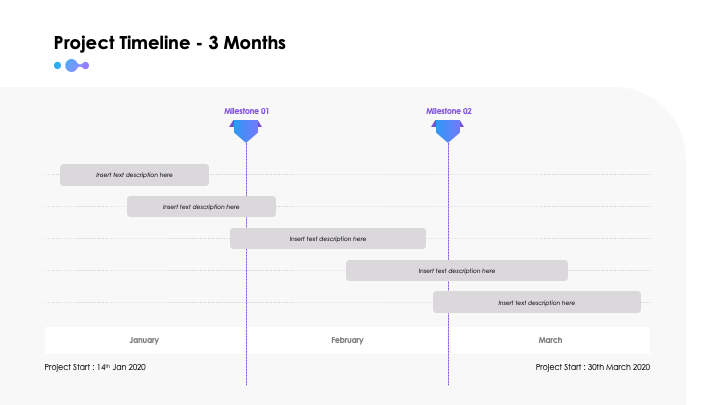
Gantt Chart - 12 Months
Dive into the 'Gantt Chart - 12 Months' slide incorporated in the well-defined 'Project Proposal' presentation. This slide essentially caters to illustrating the duration, commencement, and completion dates of various tasks necessary for the project proposal in discussion. It also designates responsibility for each task. Clear communication and effective time management form the crux of this slide. It's the epitome of meticulous planning - making it a catalyst in the successful execution of a project.
Download slide
DARK VERSION
Project Proposal
PowerPoint
28 Slides
Project Proposal
Apple Keynote
28 Slides
Project Proposal
Google Slides
28 Slides
LIGHT VERSION
Project Proposal
PowerPoint
28 Slides
Project Proposal
Apple Keynote
28 Slides
Project Proposal
Google Slides
28 Slides
To continue, enter your email:
Preview

Full preview (28 Slides)