Slide of
Yearly Planner Presentation
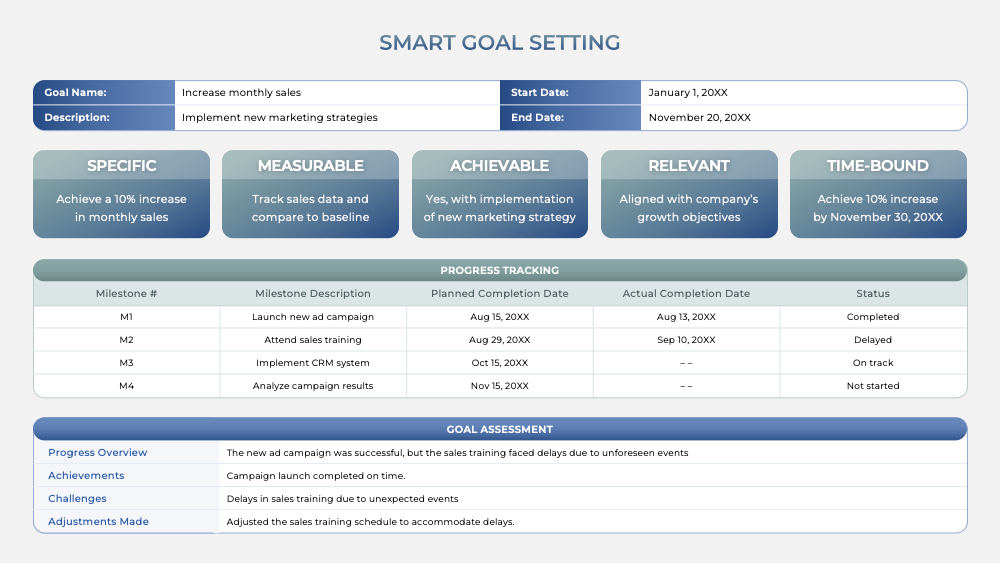
Goal Tracking Dashboard
Dive into the 'Goal Tracking Dashboard', a slide that serves as a visual representation of progress towards objectives. It employs a variety of charts including pie, donut, area, combo, and line graphs to illustrate task status updates and progress percentages. This slide is a powerful tool for tracking team, company, and personal goals. It provides a clear snapshot of where one stands in relation to their objectives, making it an essential component of the 'Yearly Planner' presentation.
Download slide
Yearly Planner
Apple Keynote
40 Slides
Yearly Planner
PowerPoint
40 Slides
To continue, enter your email:
OR
Already have an account?
Log in
Preview

Full preview (40 Slides)
s