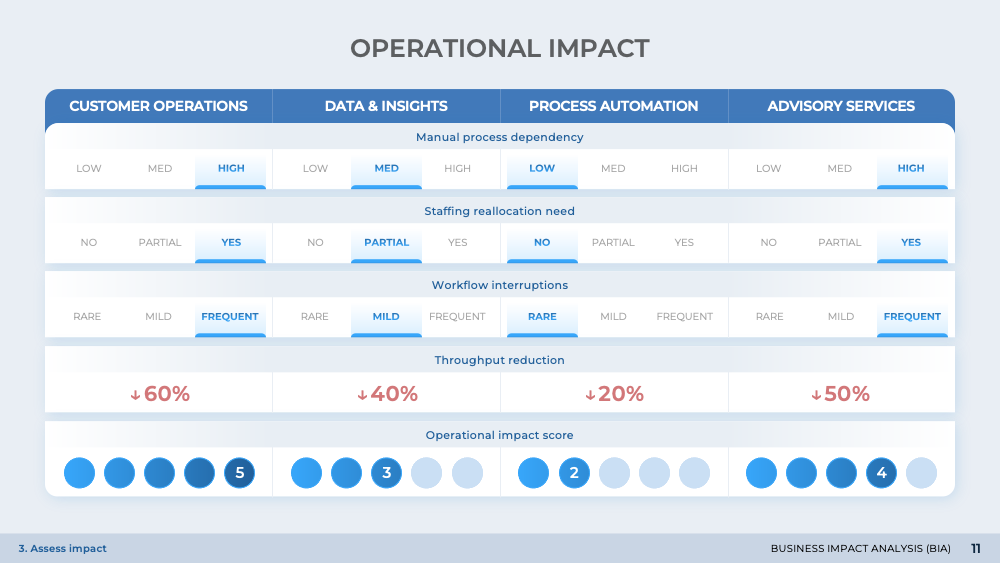
Impact Heatmap
An integral part of the BIA presentation, the 'Impact Heatmap' slide provides a visual representation of potential business disruptions. It categorizes disruptions based on their impact score and disruption scale, using color-coded severity heatmaps. This slide is instrumental in understanding the magnitude of potential impacts and aids in prioritizing recovery strategies. The impact table further breaks down the impact categories, offering a comprehensive view of the disruption landscape.