Slide of
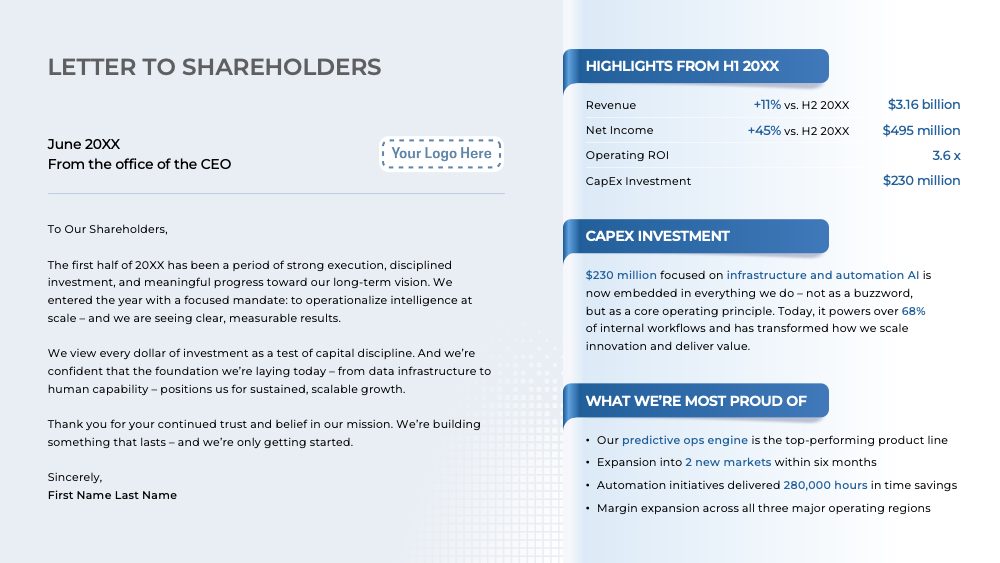
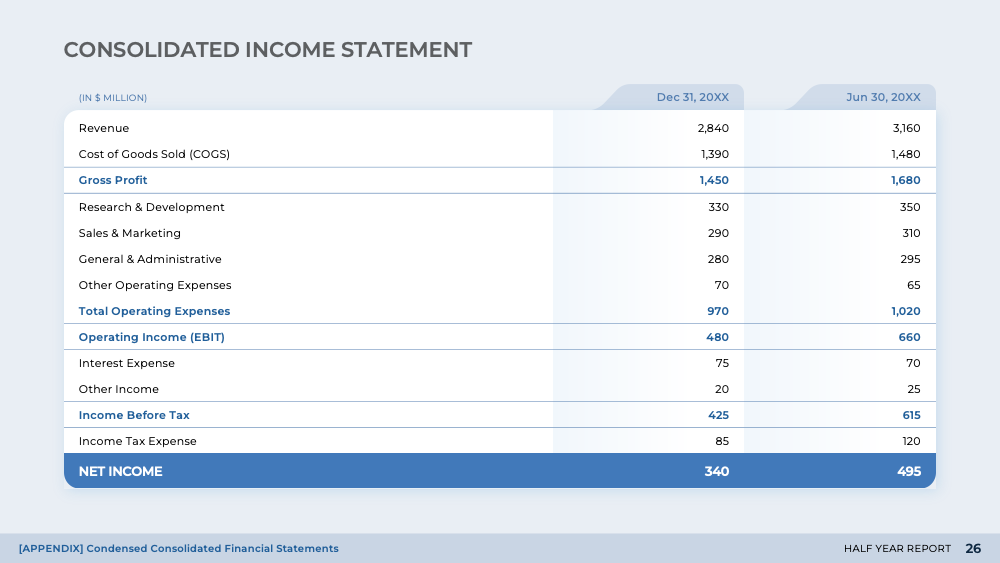
Diving into the financial aspect of the Half Year Report, the slide titled 'OPEX Structure' provides a comprehensive view of the organization's operational expenses. It highlights the cost drivers, year-on-year cost comparison, and the financial impact of these expenditures. The slide uses visual aids such as line graphs and scatterplot charts to present the data in an easily digestible format. It also discusses the return on investment (ROI) from these operational expenditures, offering a clear picture of the organization's financial health and operational efficiency.


Half Year Report
PowerPoint


Access the full library of business templates


Download our free templates each week
No credit card required
Every template is a business framework.
Easy to customize and present to save time.
Used by over 1.3m professionals around the world.