
Slide of
Infographic Collection Presentation
Procedural Infographic
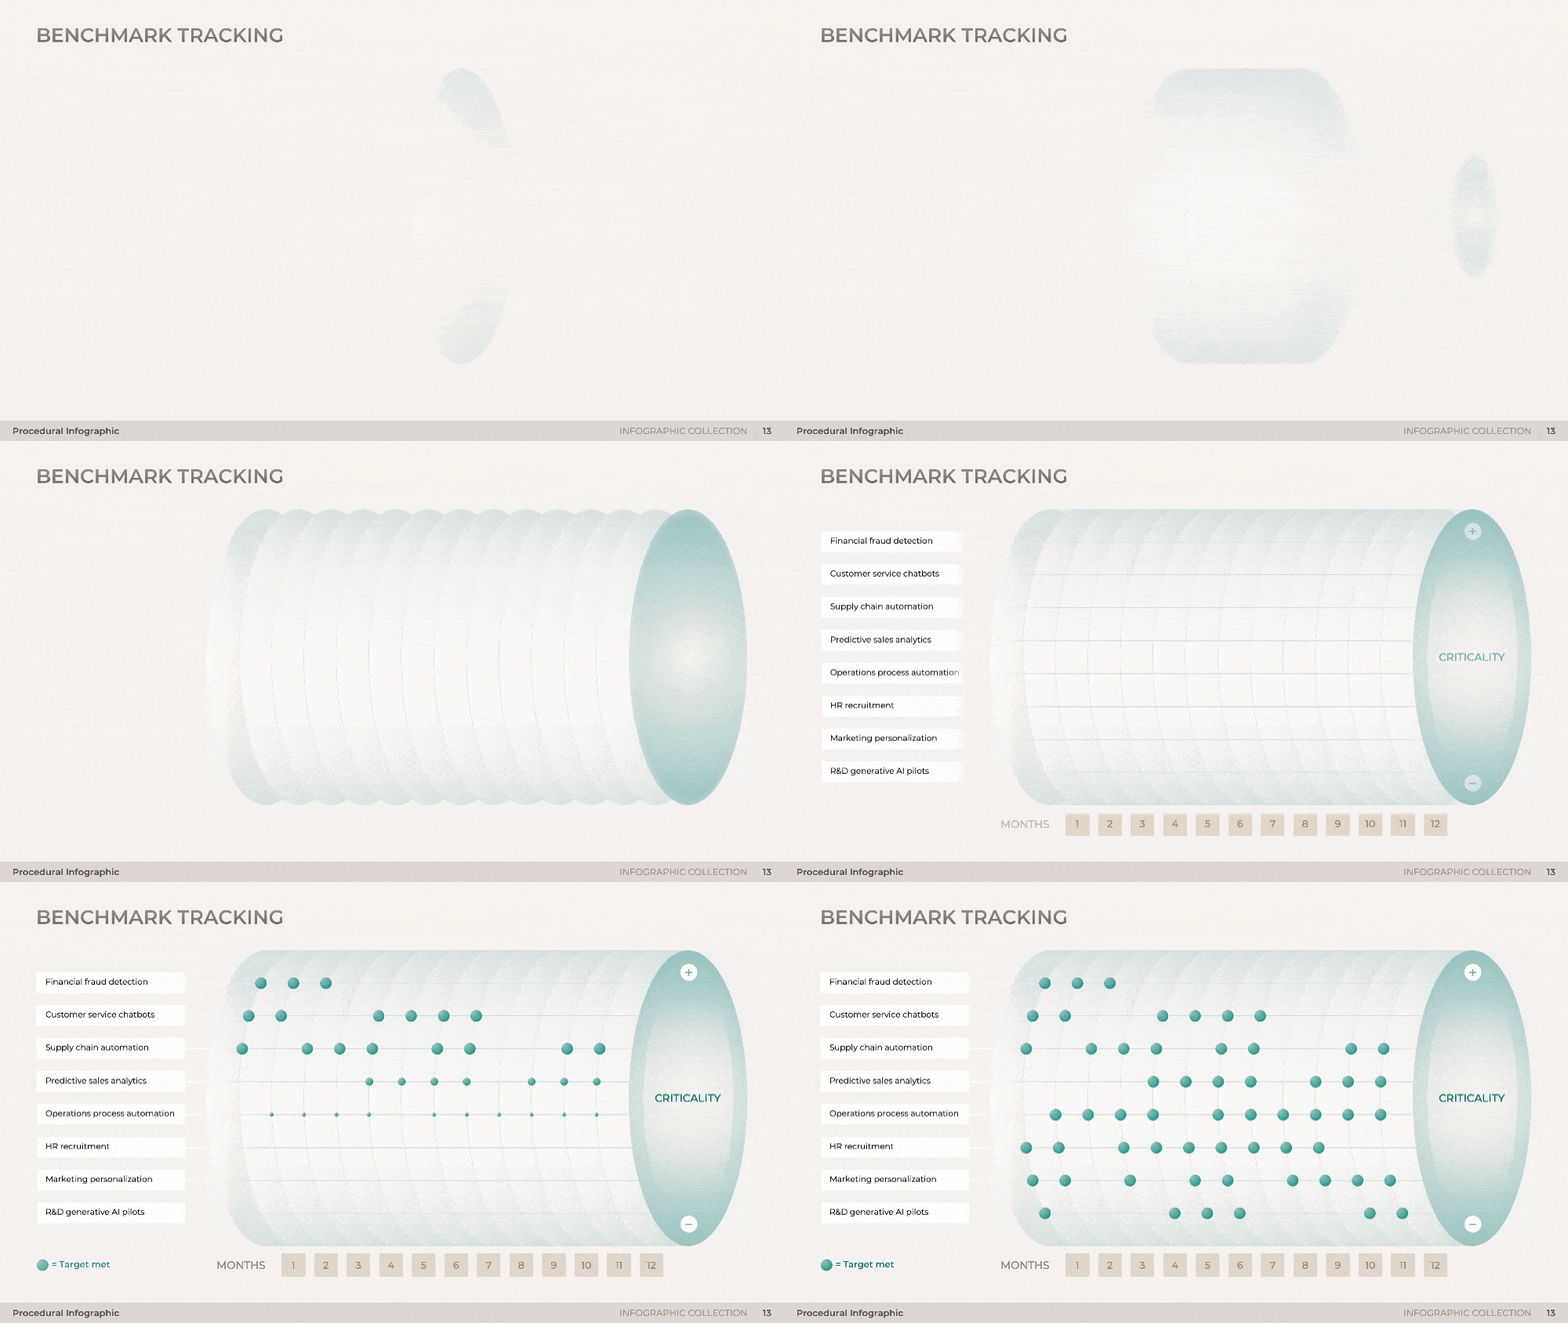
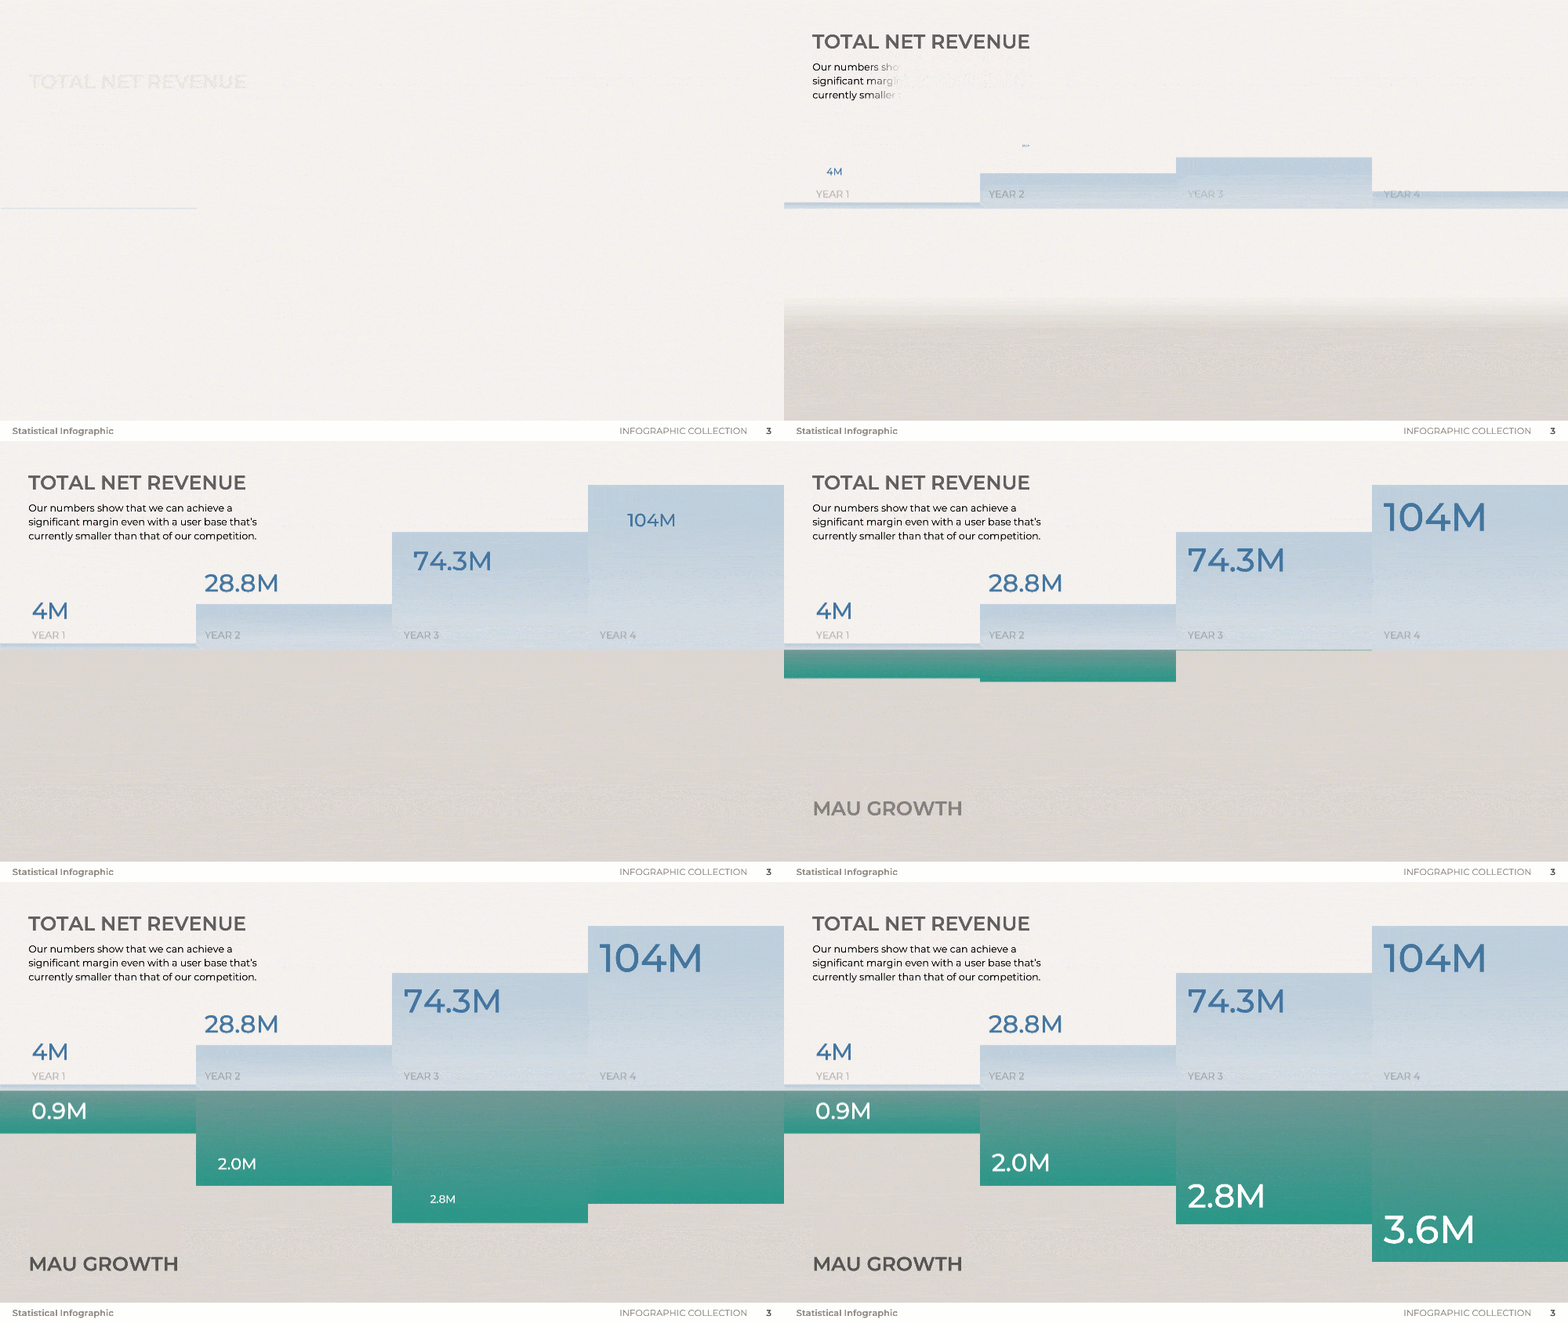
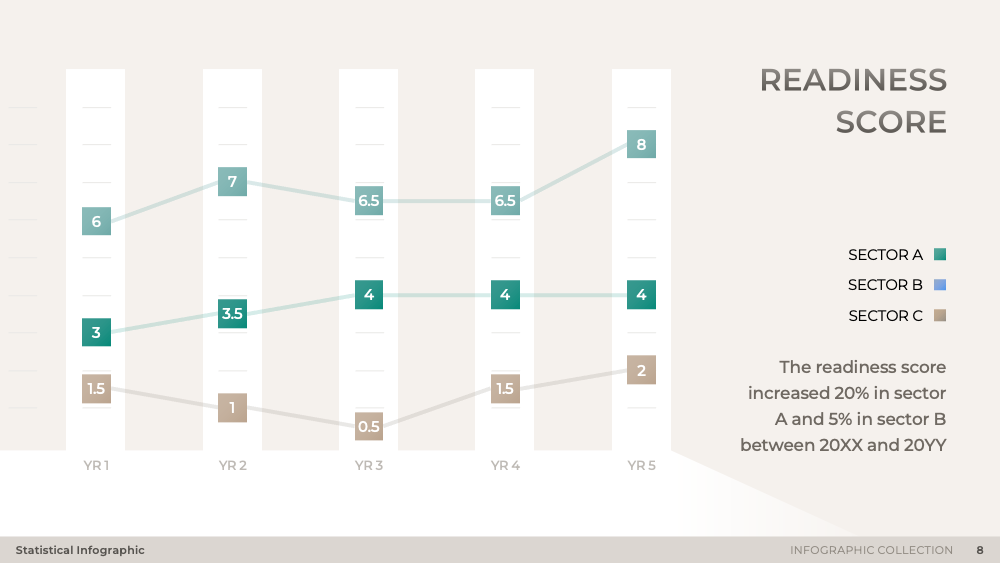
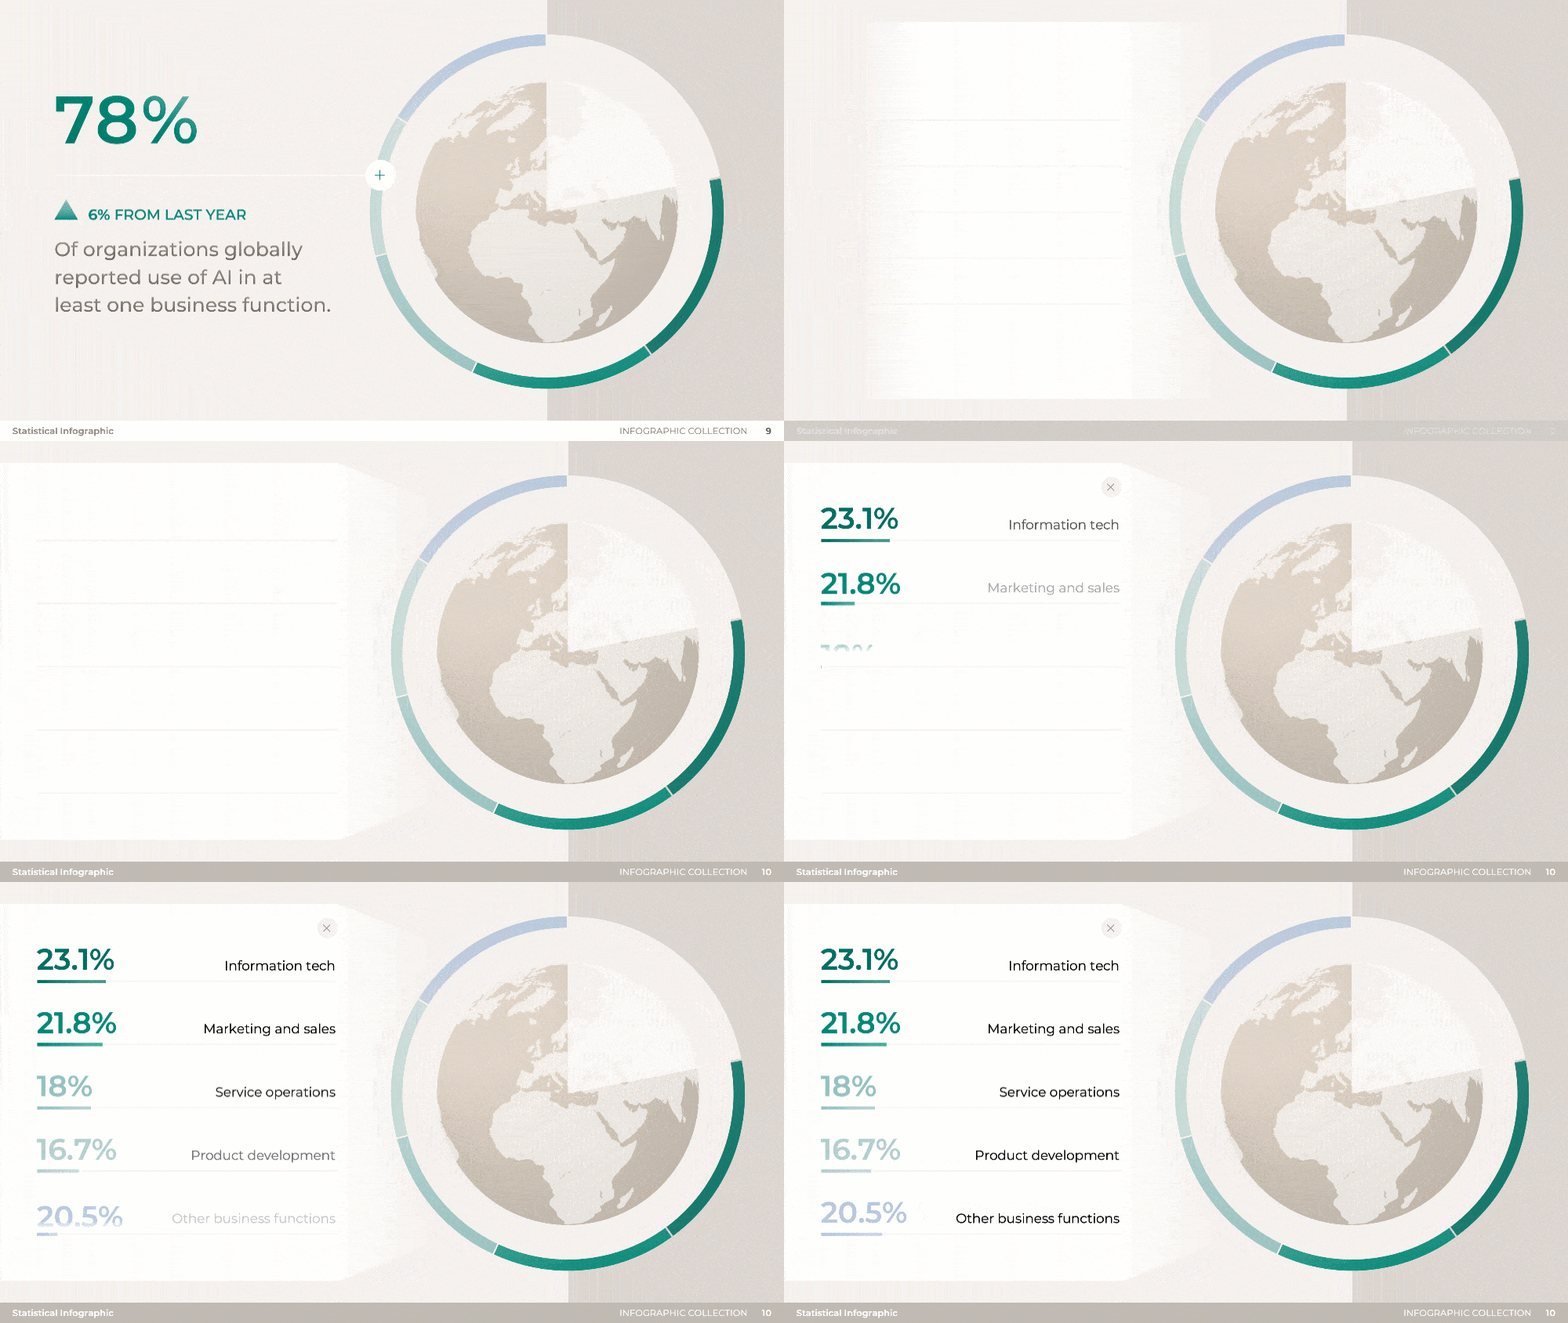
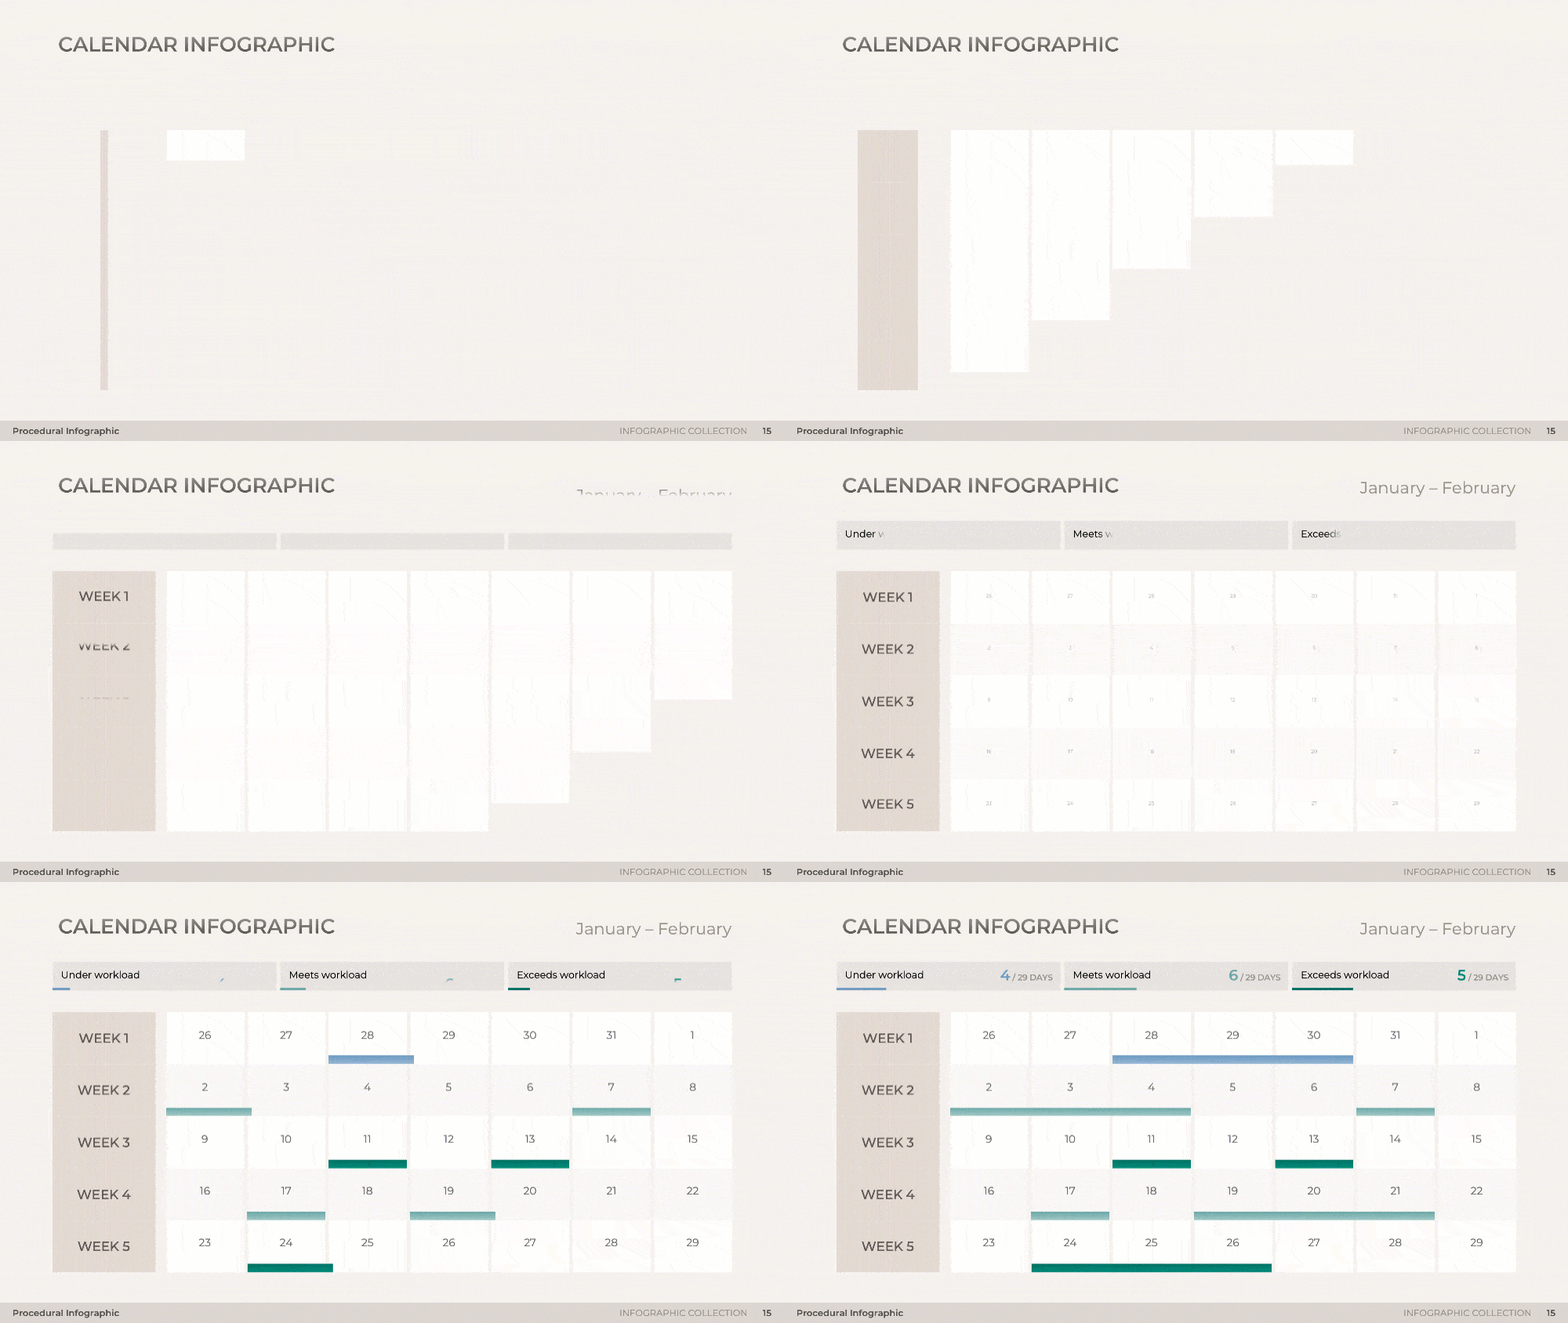
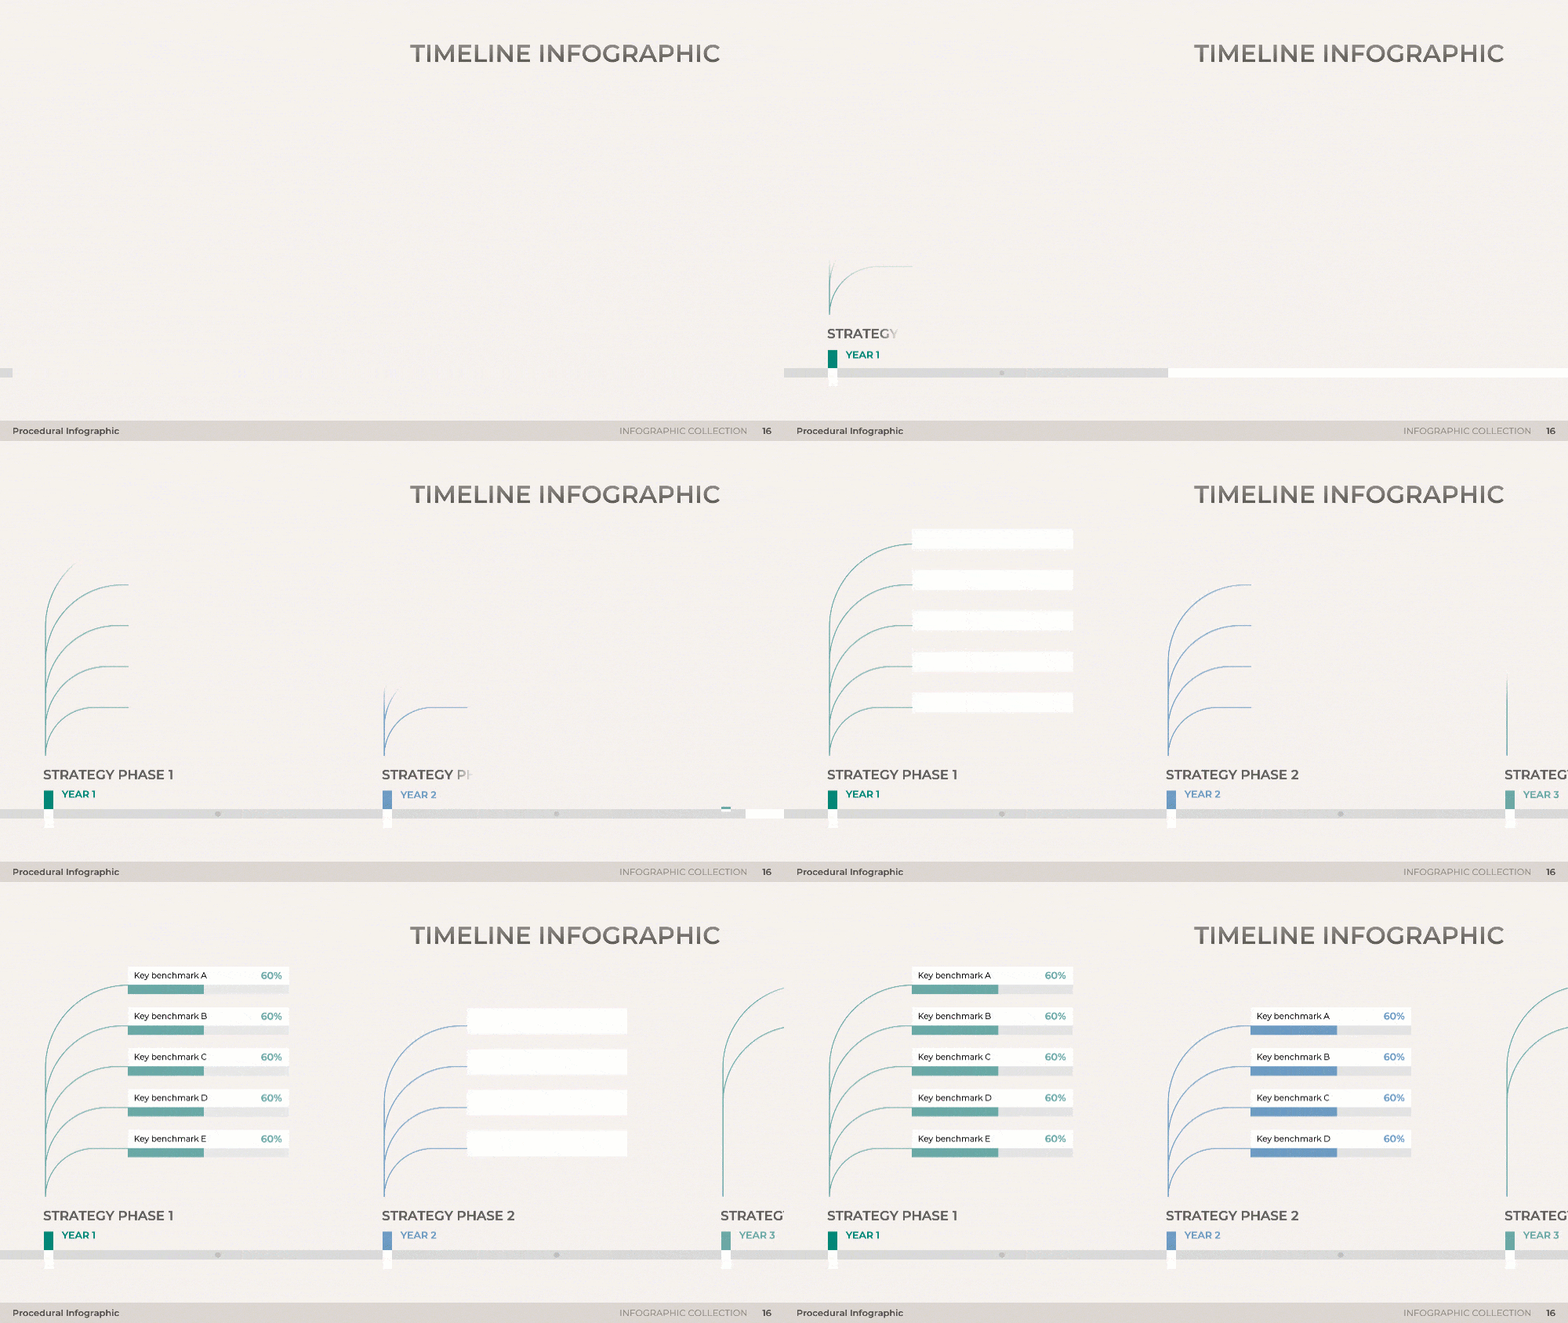
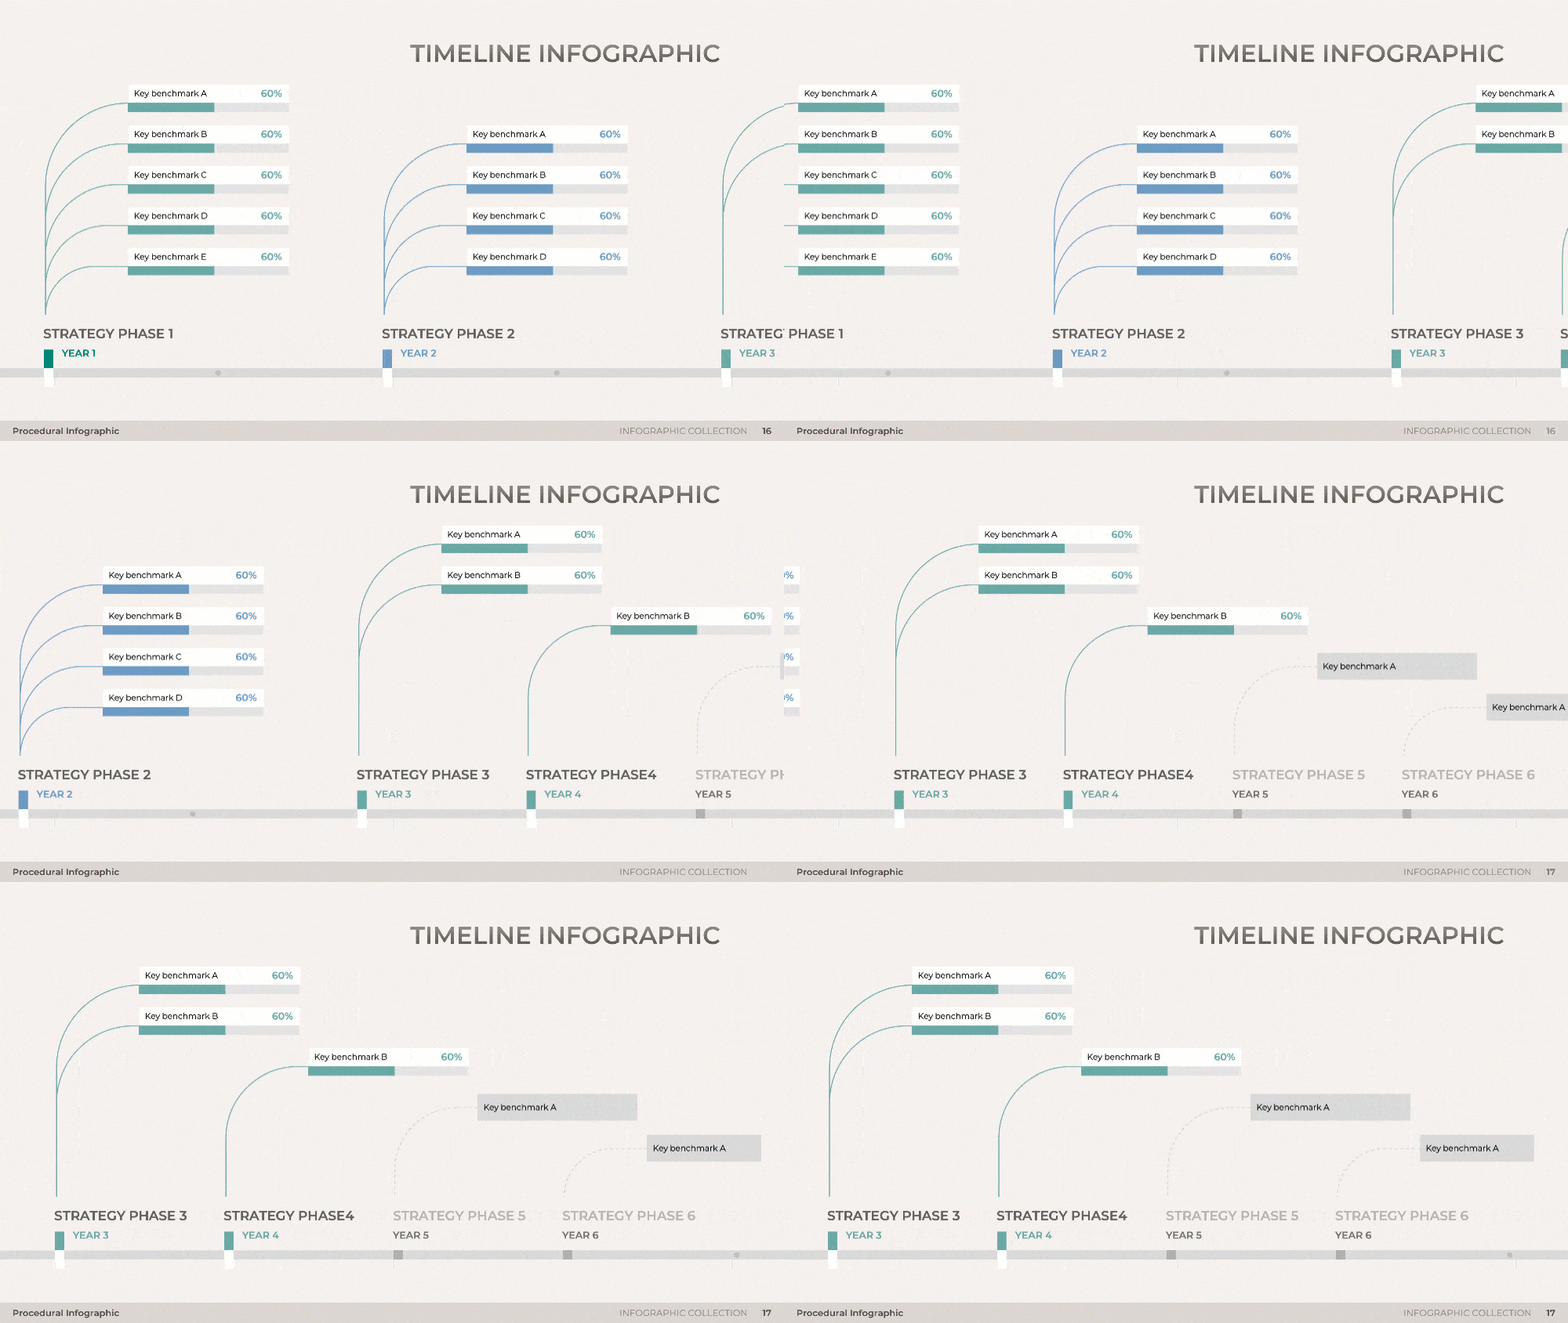
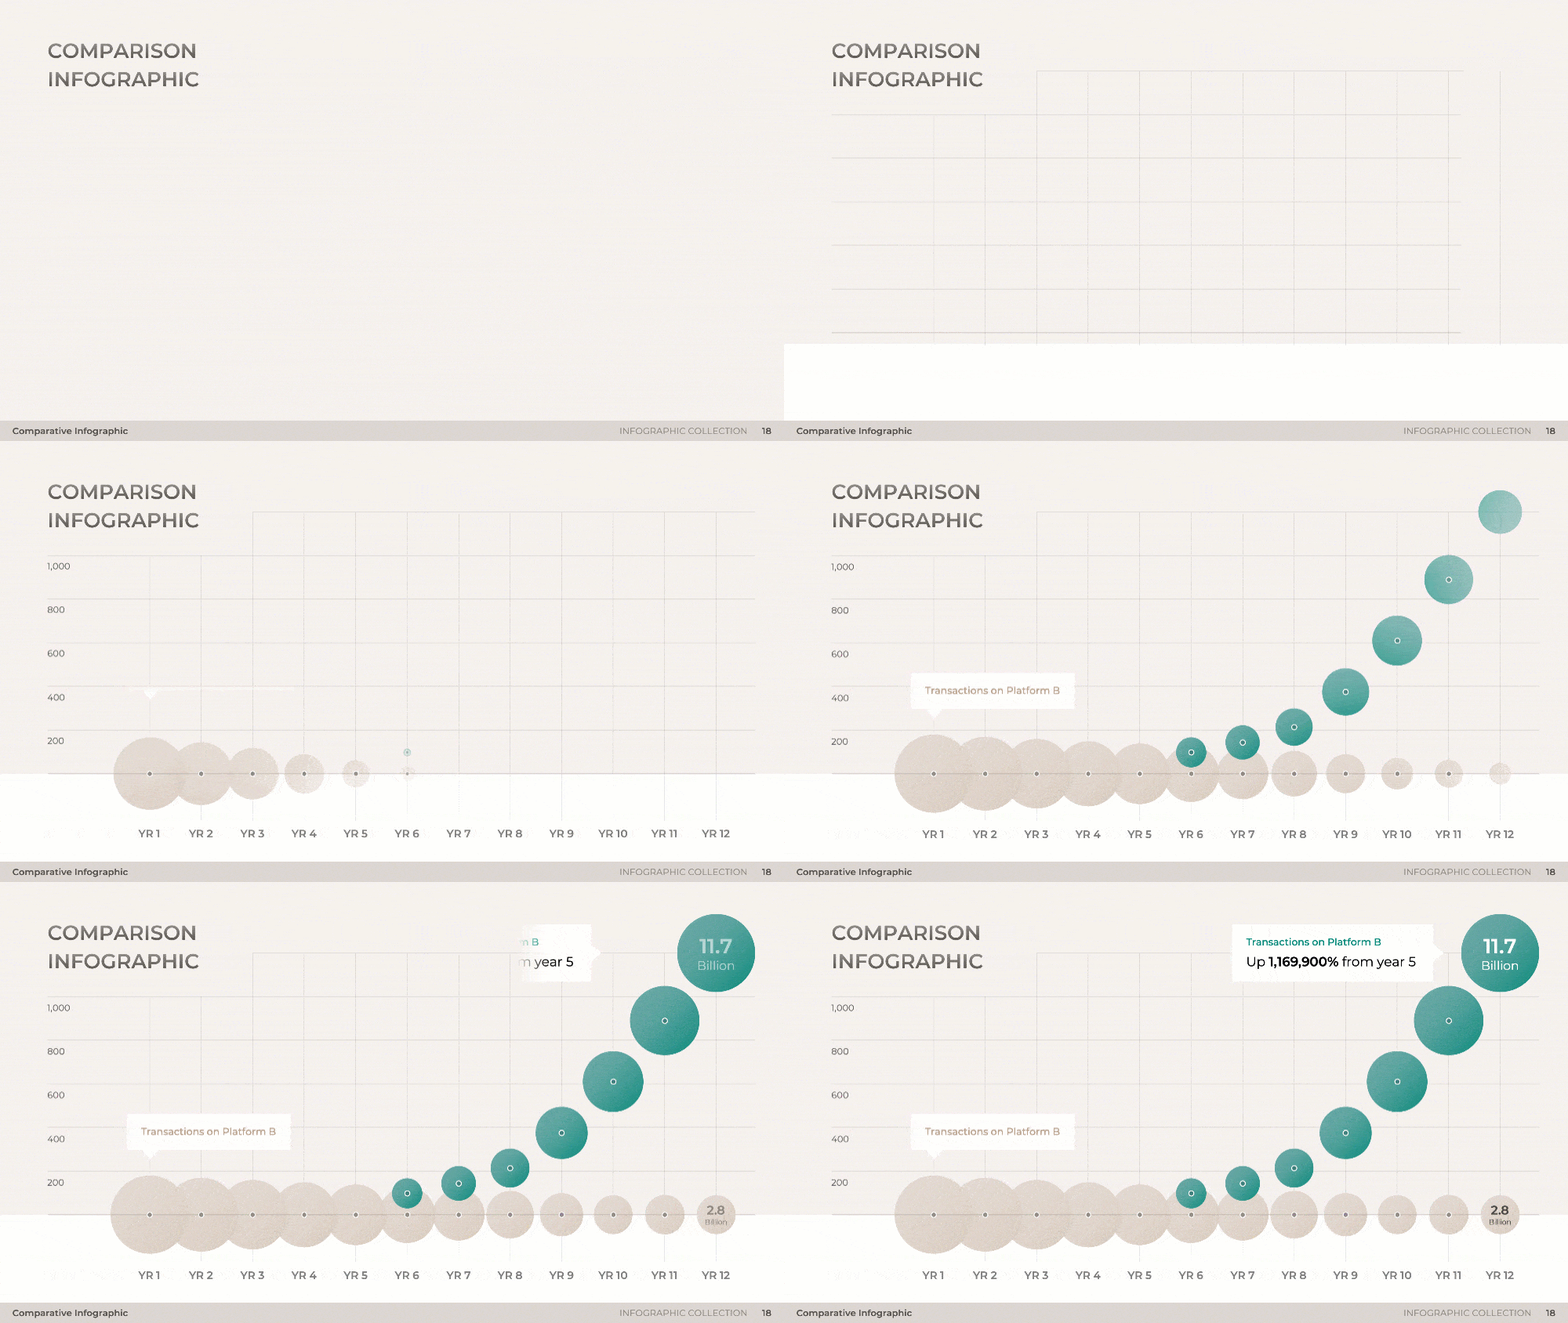
Delving into the core of the Infographic Collection, the Procedural Infographic slide is an essential tool. It beautifully illustrates the evolution of data over time, using engaging visuals such as matrix diagrams, cylinder graphs, and dot plot maps. This slide is designed to transform raw metrics into insightful narratives. With its focus on process infographic and number change, it provides a clear, simplified view of complex relationships. The Procedural Infographic slide is perfect for those who wish to present data in a compelling and intuitive manner.
Download slide
Infographic Collection
Available inPowerPoint
PowerPointFree to join · No credit card · Already a member? Log in
Sign up for free
Get access to this week’s free selection.
A new set of full templates every week.
Already a member? Log in
Preview
Full preview (25 Slides)
s

















Trusted by top partners


