Slide of
Process Management Presentation
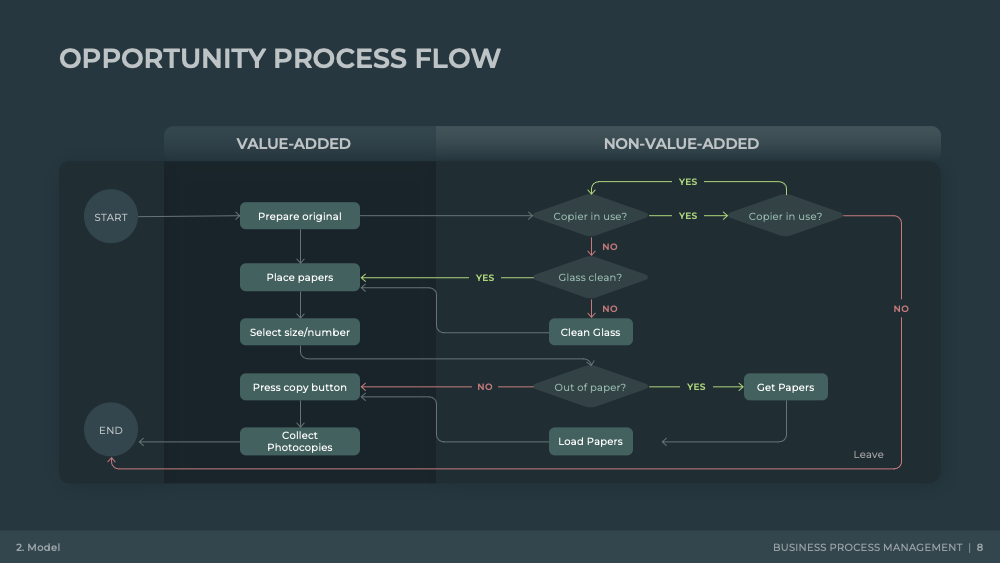
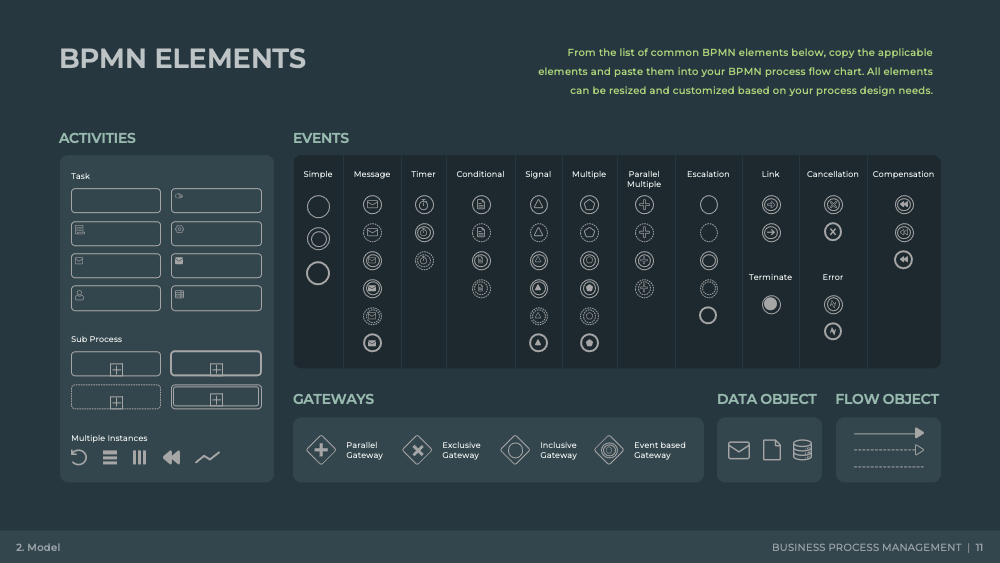
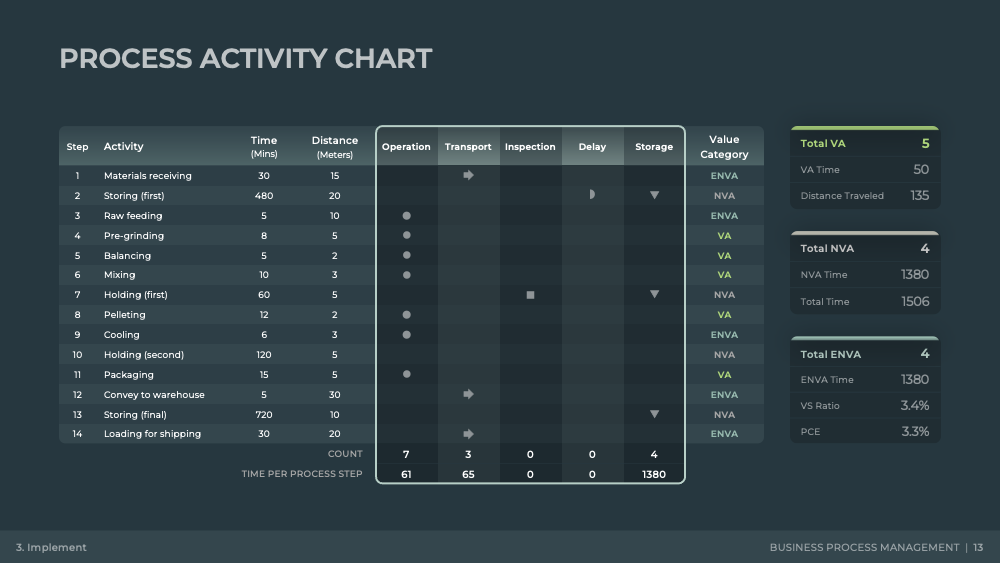
Process Activity Chart
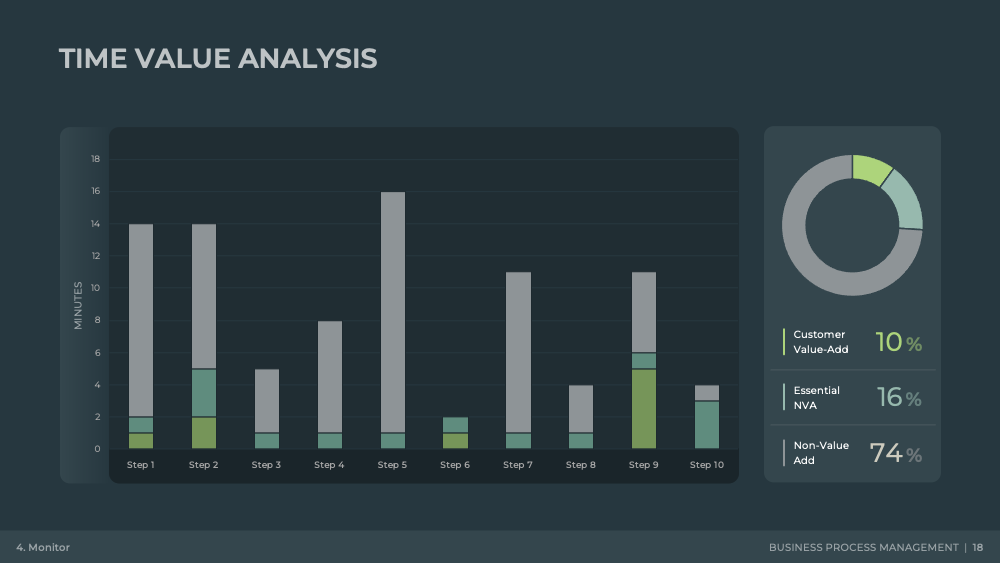
Delving into the 'Process Activity Chart' slide, it showcases a systematic breakdown of process activities. The slide effectively maps out process steps, time spent, and value-added time, providing a comprehensive view of the process flow. It serves as a practical tool to identify value-added (VA), non-value-added (NVA), and essential non-value-added (ENVA) time. This visual representation aids in pinpointing areas of improvement and optimizing workflow, ultimately strengthening the overall process management.
Download slide
Process Management
PowerPoint
21 Slides
To continue, enter your email:
OR
Already have an account?
Log in
Preview
Full preview (21 Slides)
s