Slide of
KPI Dashboards (Part 1) Presentation
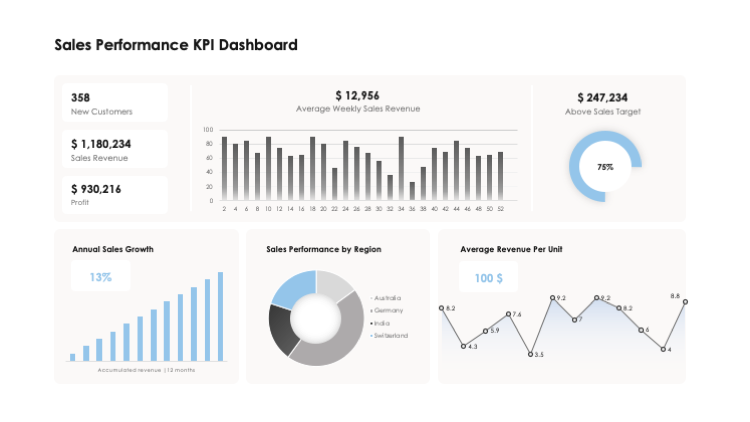
Product Sales Analysis KPI Dashboard
Delving into 'Product Sales Analysis KPI Dashboard,' a pertinent slide from the 'KPI Dashboards (Part 1)' presentation, allows access to significant metrics. It offers deep insights into the minimum selling price, average selling price, total orders, and quantity aspects of any organization's product sales. This unearths hidden trends, patterns, and correlations, allowing executives to make informed strategic decisions. Critical for anyone studying management or supervising sales processes, this slide serves as a robust tool for monitoring and enhancing the overall sales function.
Download slide
KPI Dashboards (Part 1)
PowerPoint
30 Slides
KPI Dashboards (Part 1)
Apple Keynote
30 Slides
To continue, enter your email:
OR
Already have an account?
Log in
Preview

Full preview (30 Slides)