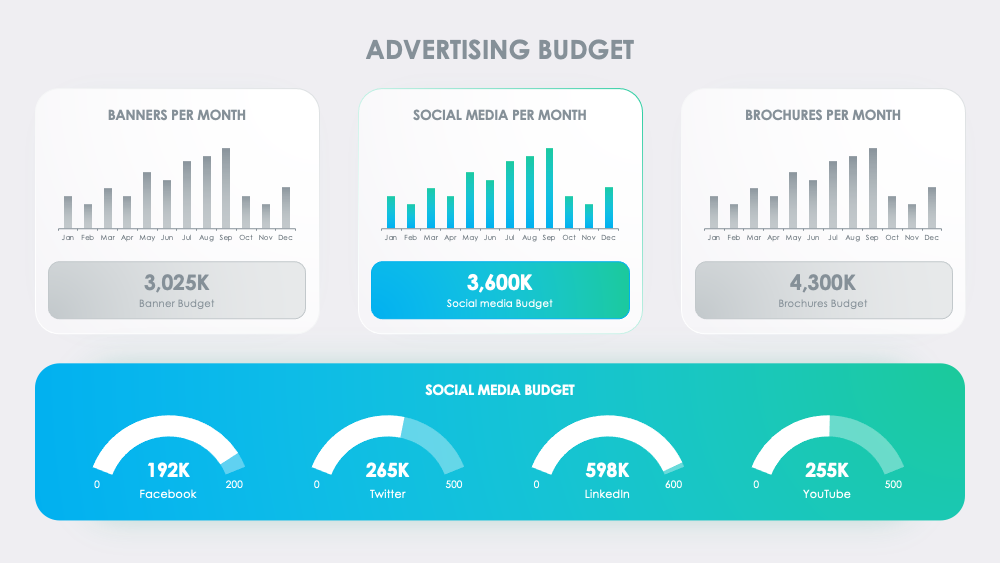
プロジェクトダッシュボード
「プロジェクトダッシュボード」スライドは、「KPIとパフォーマンスメトリクス」プレゼンテーションの重要な部分です。バーチャート、収益グラフ、競合他社の販売ユニット数、全体的なプロジェクトのステータスなどの重要な要素を描写し、プロジェクトの進行状況を明確かつ簡潔に更新するように設計されています。これは、さまざまなKPIとパフォーマンスメトリクスの相互作用を描き出し、プロジェクトが設定された目標に対してどのように達成しているかの明確なイメージを刻み込みます。ダッシュボードは、プロジェクトのパフォーマンスを追跡、評価、測定するための重要なツールであり、チームメンバーに自己信頼と責任感を植え付けます。
Download slide
KPIs and Performance Metrics
PowerPoint
30 Slides
KPIs and Performance Metrics
Apple Keynote
30 Slides
To continue, enter your email:
OR
Already have an account?
Log in
Preview

Full preview (30 Slides)
s