프로젝트 대시보드
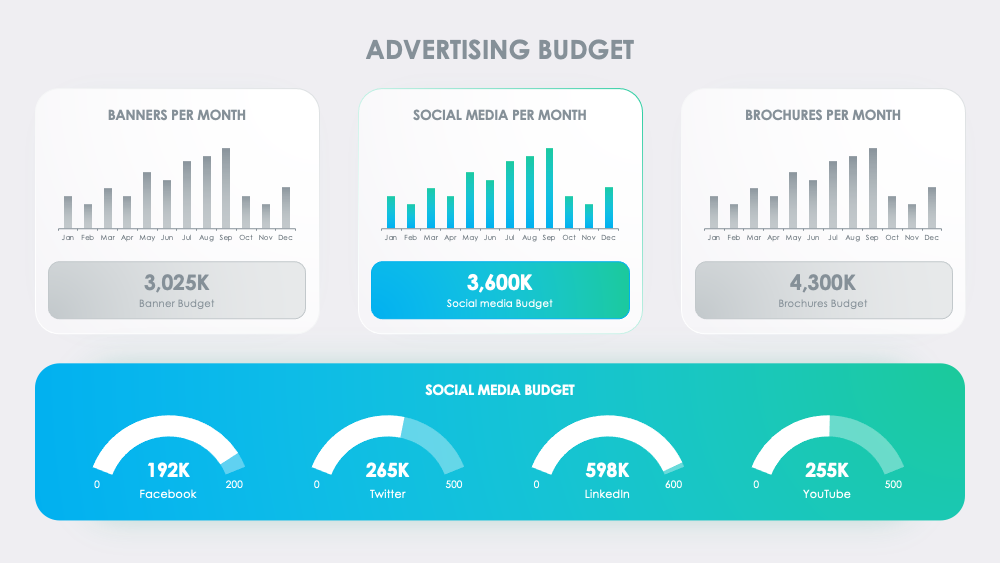
'프로젝트 대시보드' 슬라이드는 'KPIs와 성과 지표' 프레젠테이션의 중추적인 부분입니다. 막대 그래프, 수익 그래프, 경쟁사 판매 단위, 그리고 전반적인 프로젝트 상태와 같은 중요한 요소를 표현하며, 이 슬라이드는 프로젝트의 진행 상황에 대한 명확하고 간결한 업데이트를 제공하도록 설계되었습니다. 이는 다양한 KPIs와 성과 지표의 상호 작용을 보여주며, 프로젝트가 설정된 목표에 대해 어떻게 나타나는지 명확한 그림을 그립니다. 대시보드는 프로젝트의 성능을 추적, 평가, 측정하는 데 중요하며, 이를 통해 팀원들에게 자립성과 책임감을 심어줍니다.
Download slide
KPIs and Performance Metrics
PowerPoint
30 Slides
KPIs and Performance Metrics
Apple Keynote
30 Slides
To continue, enter your email:
OR
Already have an account?
Log in
Preview

Full preview (30 Slides)
s