Slide of
KPI Dashboards (Part 2) Presentation
Revenue Insights Dashboard
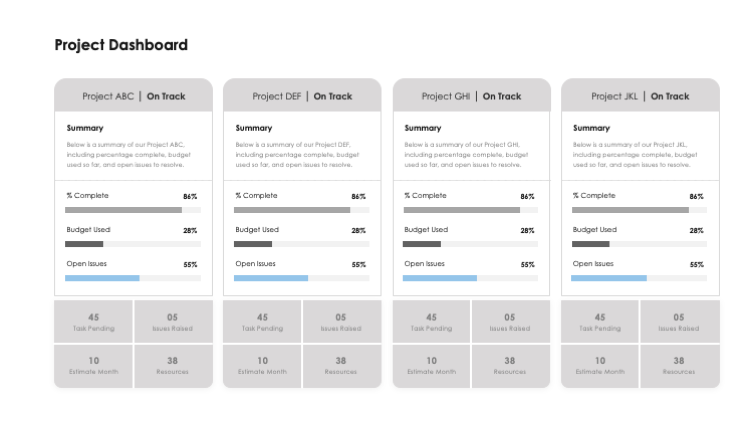
Dive deep into the financial realm with the 'Revenue Insights Dashboard' slide, a part of the fresh KPI Dashboards (Part 2) series. This slide will shed light on insights extracted from the buy and sell records, alongside showcasing the dividend and revenue aspects. A special highlight of this slide is its dashboard feature, providing a superior experience in tracking and visualizing key metrics. A cohesively designed resource for those interested in project and product reports; guaranteed to make work more efficient, eliminating numerous hours of labor.
Download & customize
KPI Dashboards (Part 2)
PowerPoint
35 Slides
KPI Dashboards (Part 2)
Apple Keynote
35 Slides


Join You Exec
Access the full library of business templates

Get full access
[[-PAYWALL_PSQ_PRICE_MONTHLY_DISCOUNTED_FORMATTED-]]
per month
Billed quarterly
that's $3 per template
Join Plus[[-PAYWALL_PSY_PRICE_MONTHLY_DISCOUNTED_FORMATTED-]]
per month
Billed yearly
that's $2 per template
Join Plus[[-PAYWALL_P3Y_PRICE_MONTHLY_DISCOUNTED_FORMATTED-]]
per month
Billed every 3 years
that's $2 per template
Join Plus
Try for free
Download our free templates each week
No credit card required
Preview
Full preview (35 Slides)