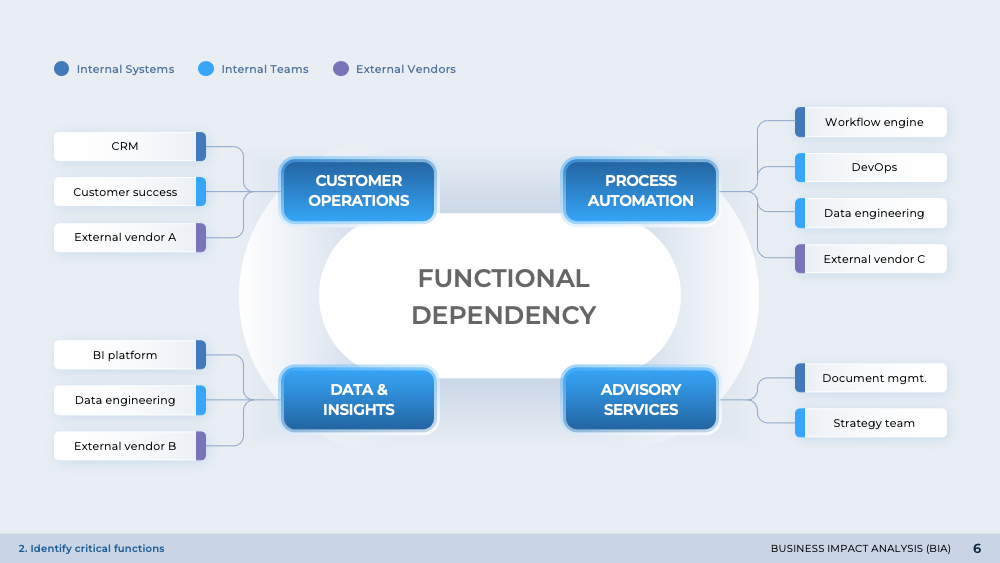
Risk Concentration Map
Unveiling the 'Risk Concentration Map', a slide from the 'Business Impact Analysis (BIA)' presentation. This slide provides a visual representation of risk sources, impact areas, and the degree of exposure to disruptions. It utilizes a radial diagram, also known as a radar chart or dot plot, to highlight high-risk areas. The purpose of this slide is to aid in the identification and understanding of risks, ultimately serving as a guide for strategic decision-making and effective leadership assignment in times of crisis.
Download slide
Business Impact Analysis (BIA)
PowerPoint
20 Slides
To continue, enter your email:
OR
Already have an account?
Log in
Preview

Full preview (20 Slides)