Slide of
ビジネスインパクト分析(BIA) Presentation
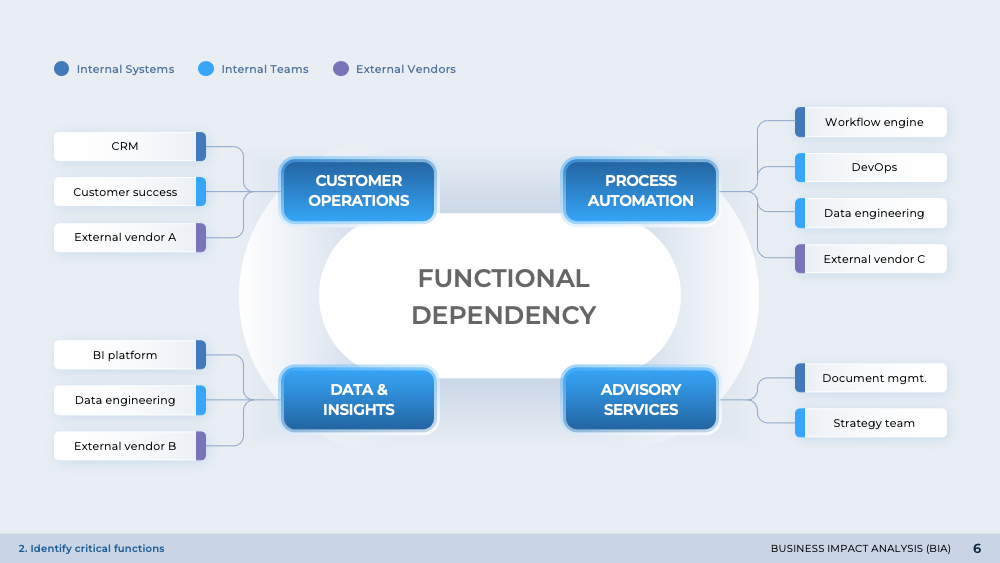
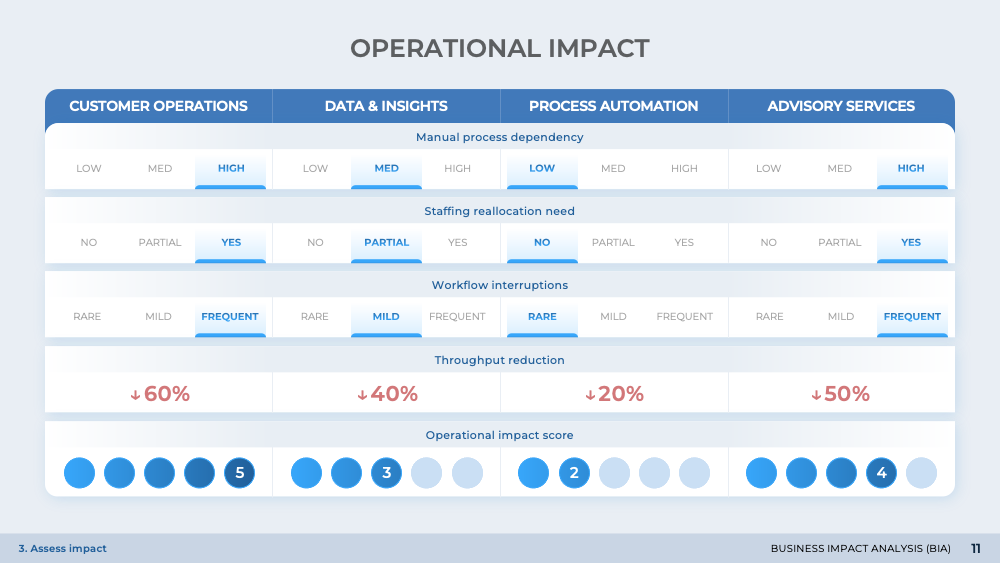
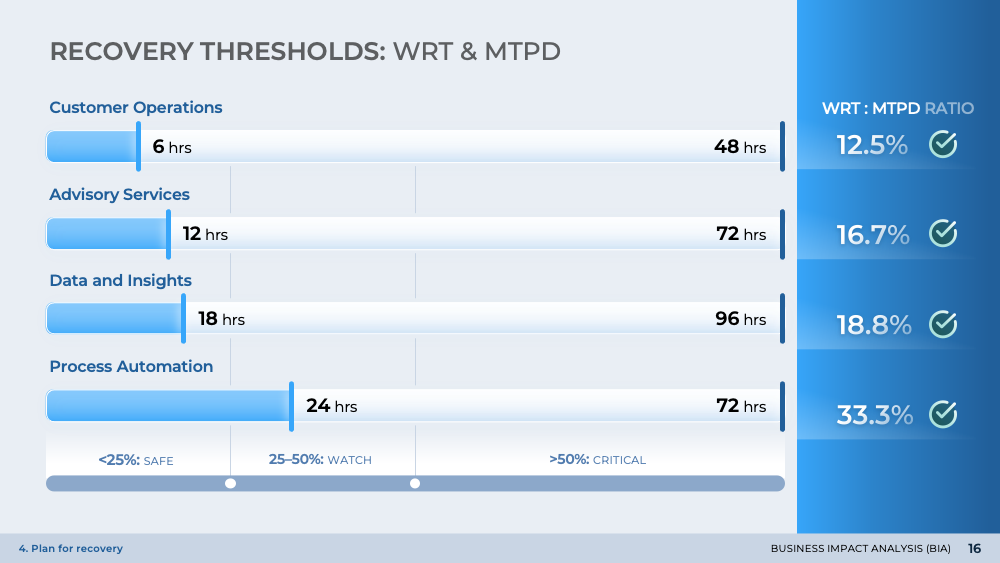
リスク集中マップ
'ビジネスインパクト分析(BIA)'のプレゼンテーションから'リスク集中マップ'を公開します。このスライドは、リスク源、影響範囲、そして中断への露出度を視覚的に表現します。これは、レーダーチャートまたはドットプロットとも呼ばれる放射状の図を使用して、高リスクエリアを強調します。このスライドの目的は、リスクの特定と理解を助け、最終的には危機時の戦略的な意思決定と効果的なリーダーシップの割り当てのガイドとして機能することです。
Download slide
ビジネスインパクト分析(BIA)
PowerPoint
20 Slides
To continue, enter your email:
OR
Already have an account?
Log in
Preview

Full preview (20 Slides)