Slide of
비즈니스 영향 분석 (BIA) Presentation
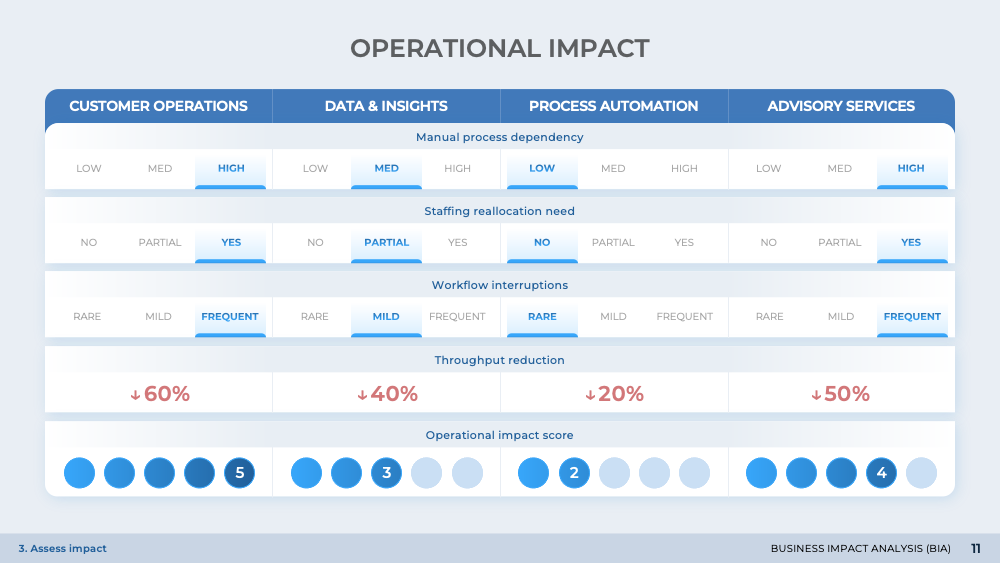
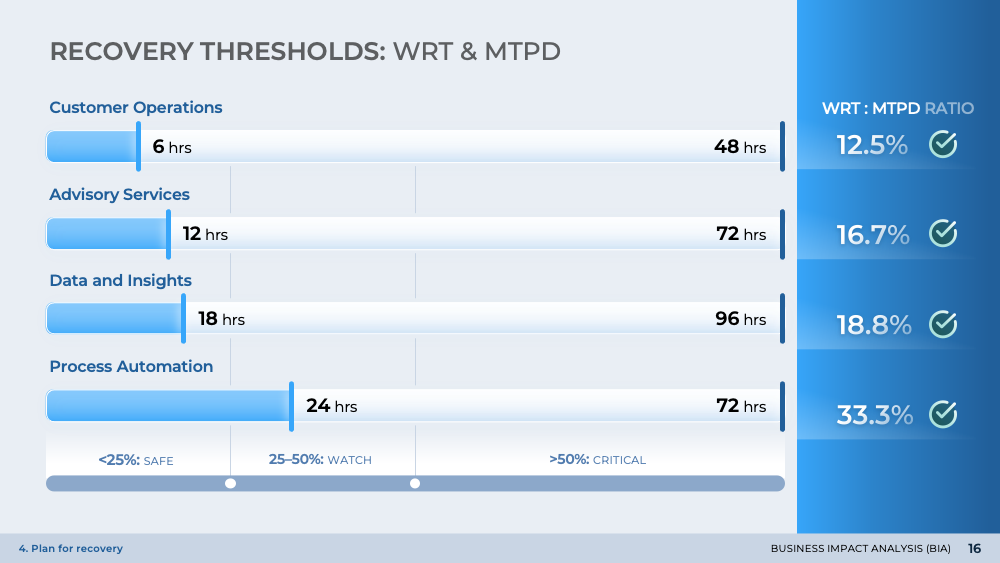
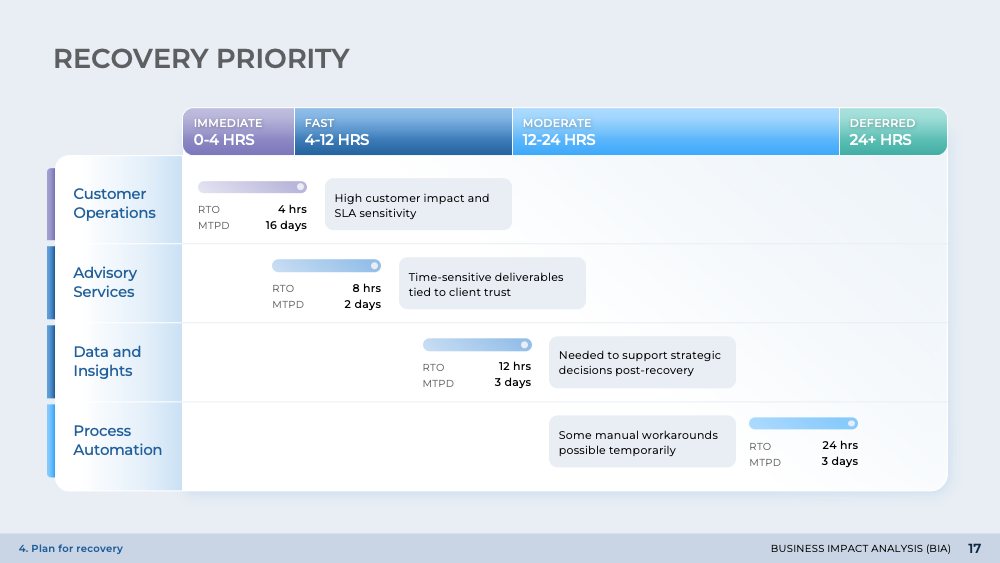
위험 집중도 지도
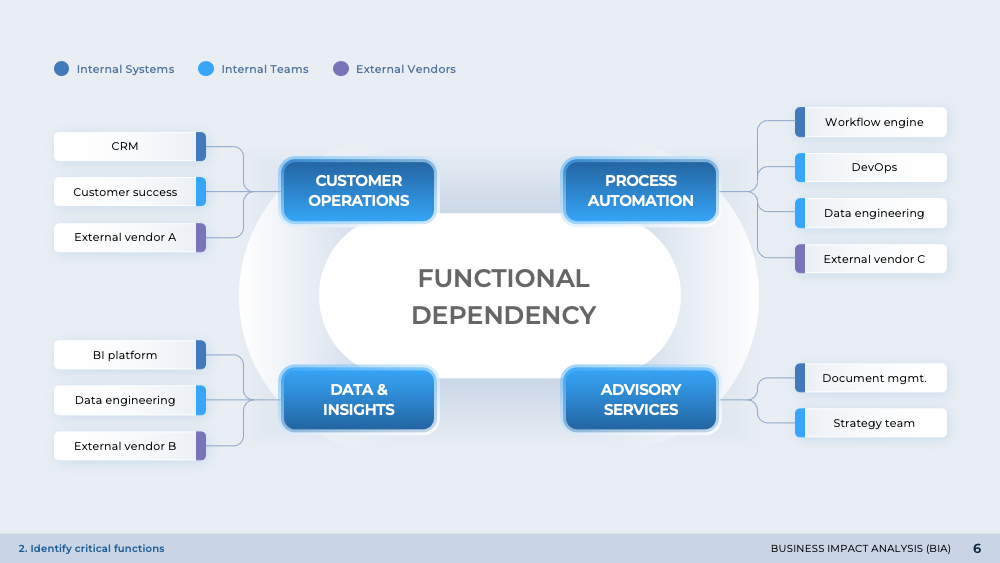
'비즈니스 영향 분석(BIA)' 프레젠테이션에서 '위험 집중도 지도'를 공개합니다. 이 슬라이드는 위험원, 영향 영역, 그리고 중단에 대한 노출도를 시각적으로 표현합니다. 레이더 차트 또는 도트 플롯이라고도 하는 방사형 다이어그램을 사용하여 고위험 영역을 강조합니다. 이 슬라이드의 목적은 위험의 식별 및 이해를 돕고, 결국 위기 시기의 전략적 의사결정과 효과적인 리더십 배정을 안내하는 데 있습니다.
Download slide
비즈니스 영향 분석 (BIA)
PowerPoint
20 Slides
To continue, enter your email:
OR
Already have an account?
Log in
Preview
Full preview (20 Slides)