Slide of
KPI Dashboards (Part 1) Presentation
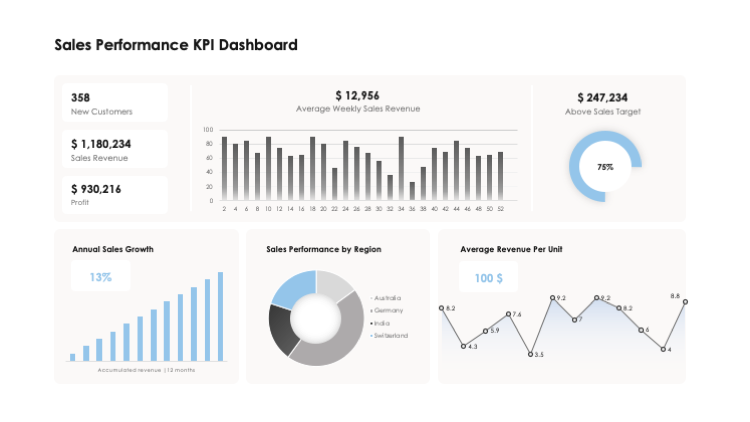
Sales Growth & Profit Margin KPI Dashboard
Diving into the heart of corporate performance metrics, the 'Sales Growth & Profit Margin KPI Dashboard' slide in 'KPI Dashboards (Part 1)' offers investors and corporate executives alike a significant tool in gauging a business's financial health. Spanning across a series of key performance indicators, it meticulously examines monthly sales growth, net profit margin, and even average revenue per unit, creating a detailed breakdown of the company's selling prowess. Additionally, it highlights performance on an individual level by showcasing sales per rep, offering insights into the contribution of each sales representative to the overall sales effort. Simply put, this slide is an important tool in measuring a company's financial performance and setting its future business goals.
Download slide
KPI Dashboards (Part 1)
Apple Keynote
30 Slides
KPI Dashboards (Part 1)
PowerPoint
30 Slides
To continue, enter your email:
Preview

Full preview (30 Slides)