Infografica della Timeline
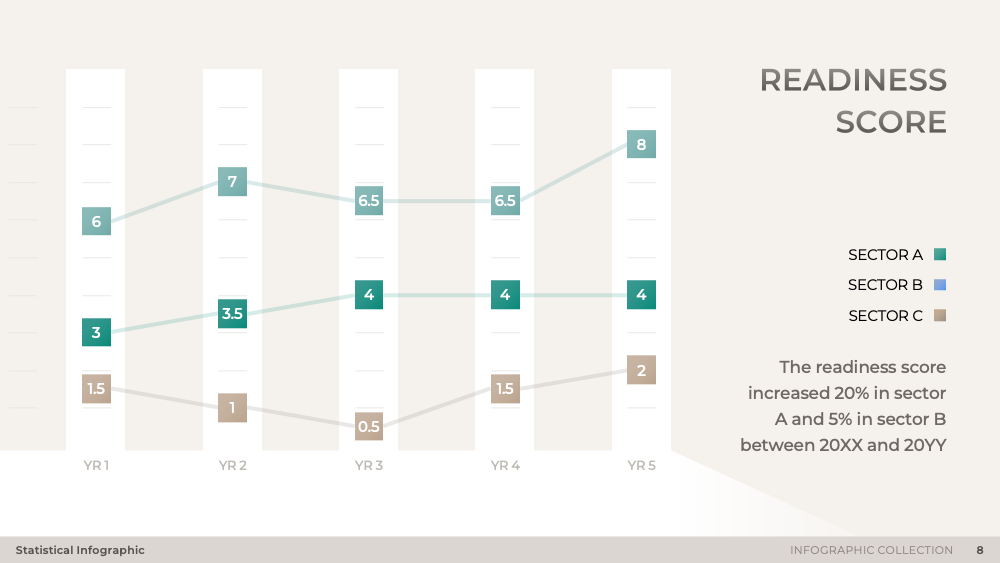
Approfondisci la diapositiva 'Infografica della Timeline', uno strumento visivo creato per rappresentare una sequenza di eventi o processi nel tempo. Utilizza una timeline orizzontale, una barra di avanzamento e una mappa stradale per tracciare traguardi e benchmark, offrendo un layout intuitivo per l'interpretazione dei dati. Il design della diapositiva trasforma le metriche grezze in schemi perspicaci, aiutando nella comprensione di scenari complessi e guidando la convinzione.
Download slide
Collezione di Infografiche
PowerPoint
25 Slides
To continue, enter your email:
OR
Already have an account?
Log in
Preview
Full preview (25 Slides)
s