Slide of
Corporate Deck Presentation
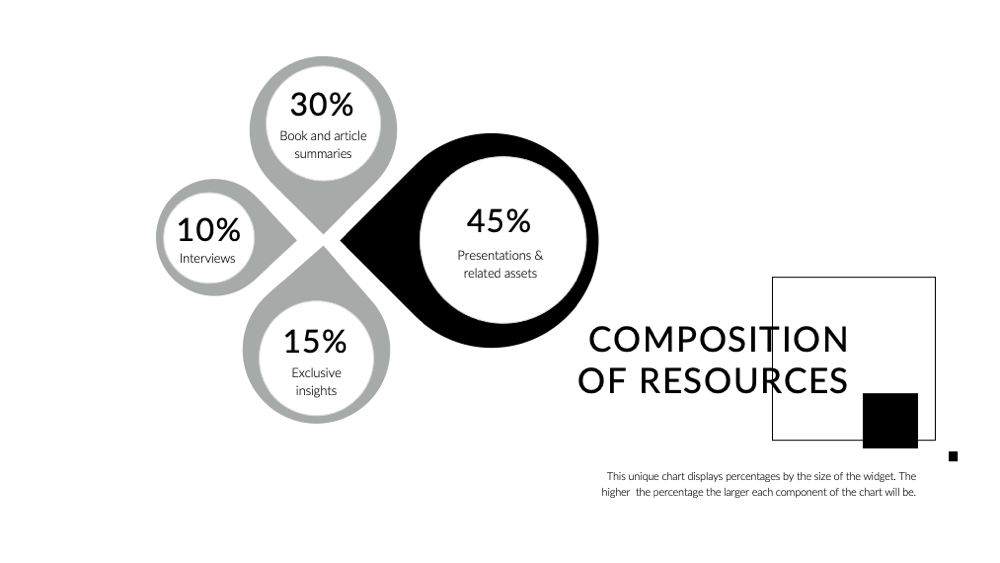
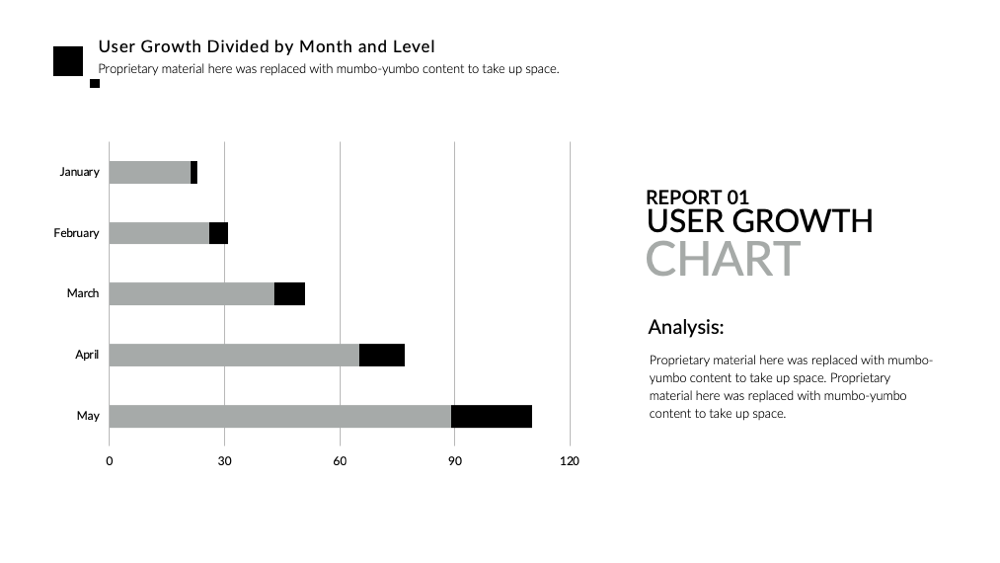
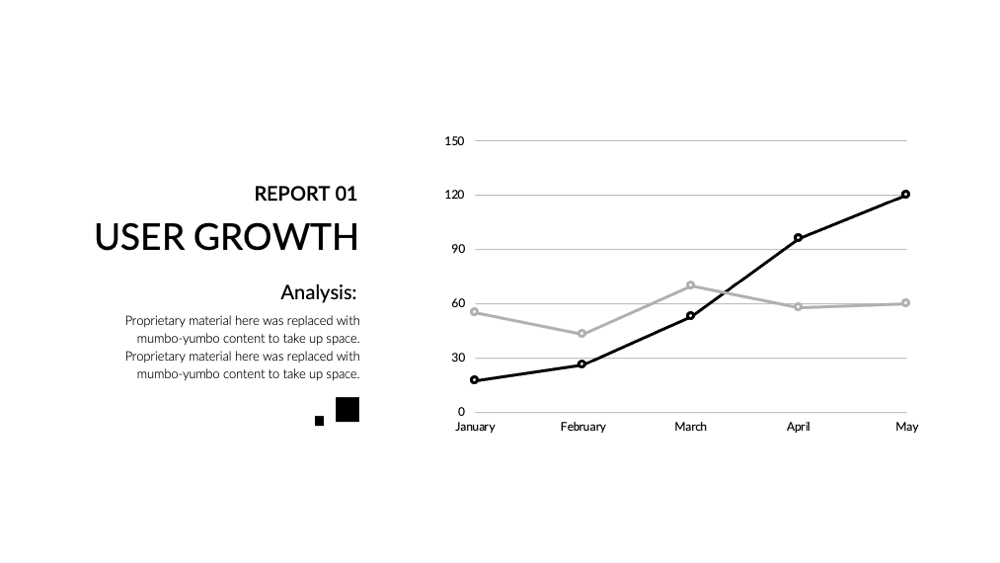
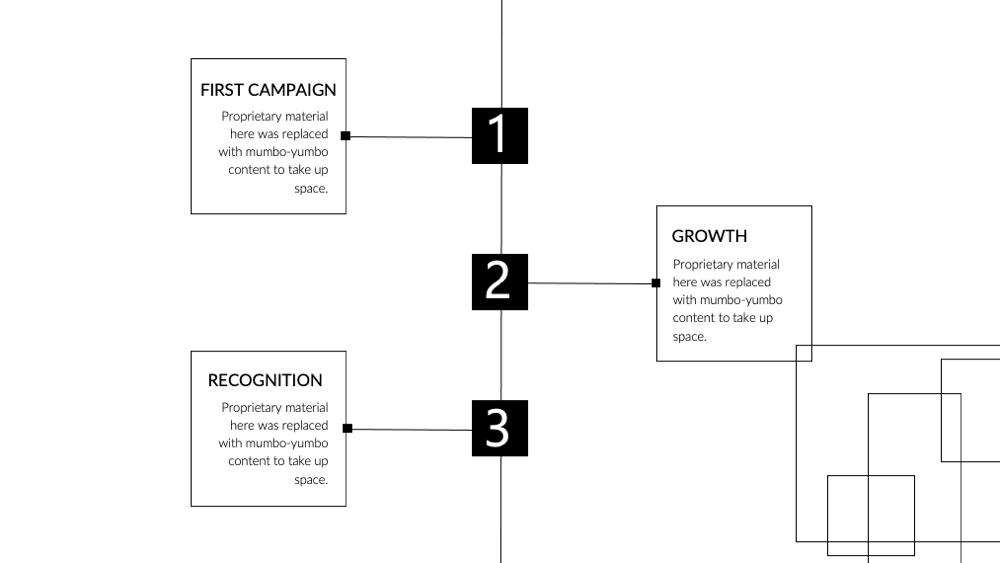
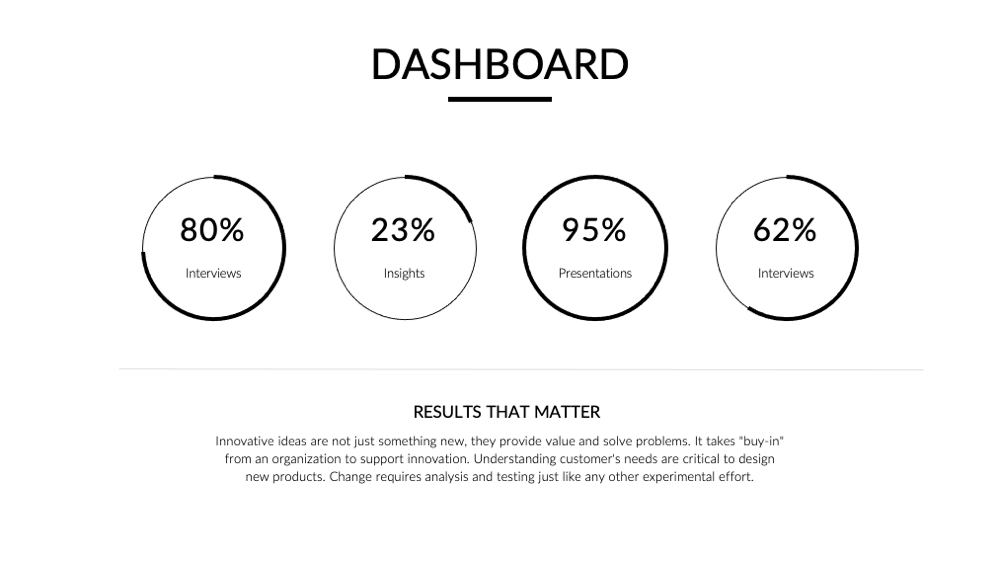
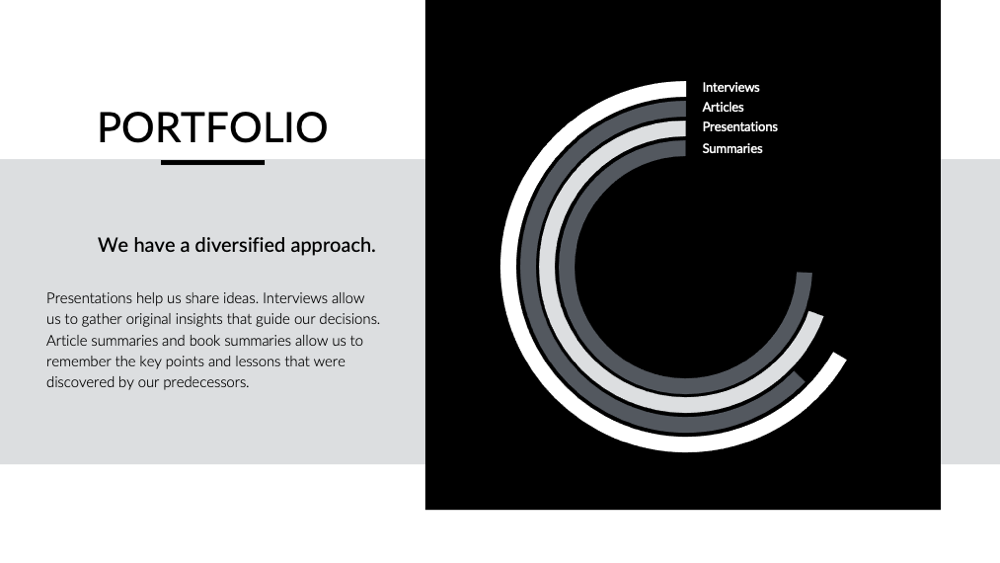
User Growth Chart
Centered on raw data and statistics, the User Growth Chart is indispensable in the 'Corporate Deck' series. Featuring influential metrics such as a bar graph, horizontal chart, and a unique representation of monthly growth, this subtly animated slide invites deep attention. The color-schemes and unique design recommend this chart for those aiming to visualize comparison in a striking and fresh manner. All in all, it elevates the comprehension and discussion of metrics, making its use in corporate presentations impactful and memorable.
Download slide
Corporate Deck
PowerPoint
49 Slides
Corporate Deck
Apple Keynote
49 Slides
Corporate Deck
Google Slides
49 Slides
To continue, enter your email:
OR
Already have an account?
Log in
Preview

Full preview (49 Slides)
s