Slide of
企業向けスライド Presentation
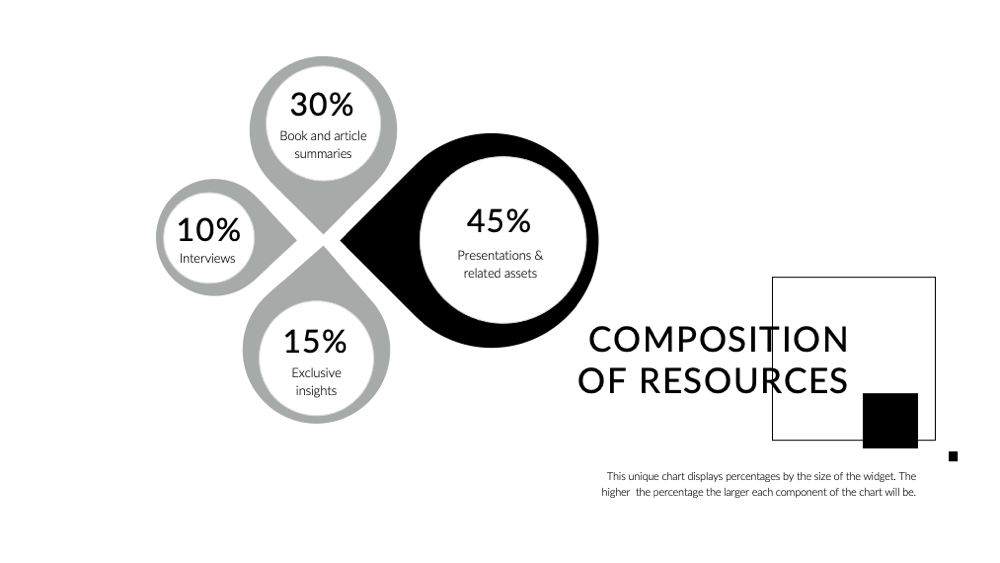
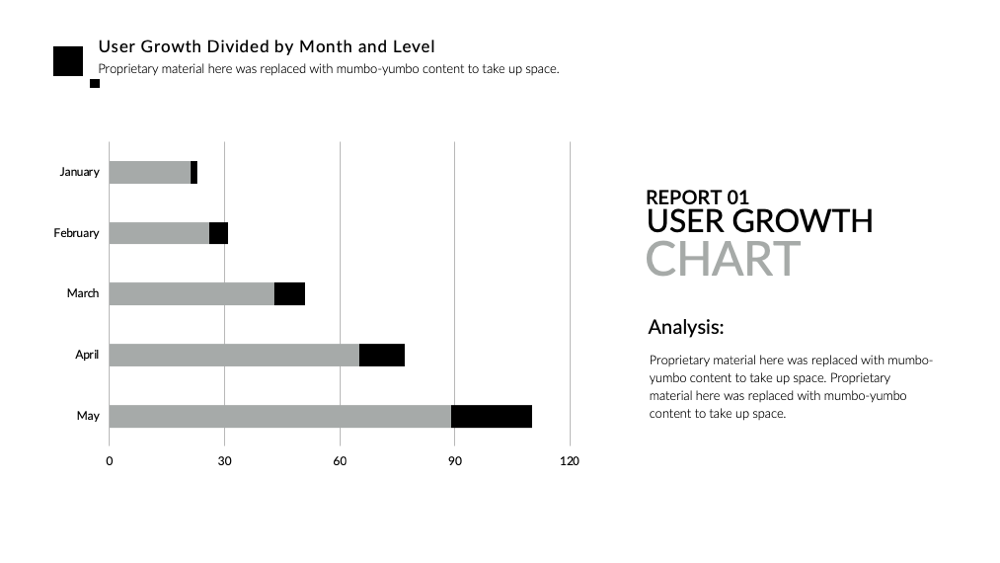
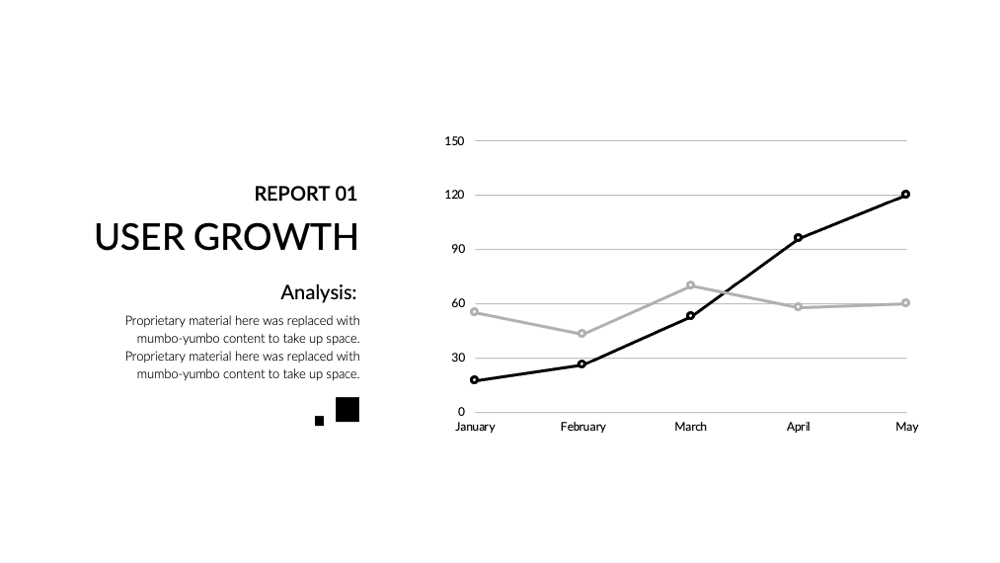
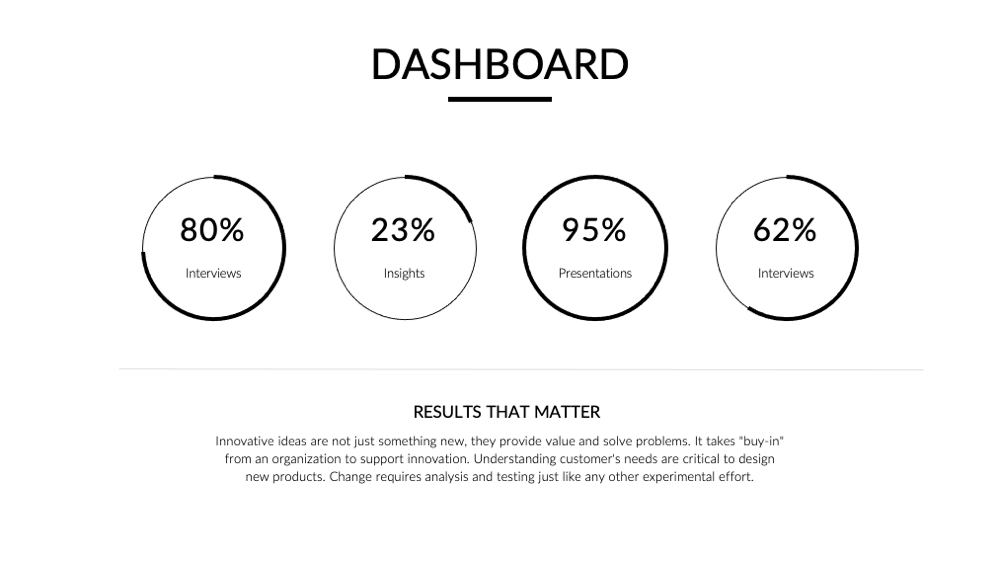
ユーザー成長チャート
生のデータと統計に焦点を当てたユーザー成長チャートは、「企業デッキ」シリーズに欠かせない要素です。棒グラフ、水平チャート、月次成長のユニークな表現など、影響力のある指標を特徴としています。この微妙にアニメーションされたスライドは、深い注目を引きます。色彩の組み合わせとユニークなデザインは、比較を鮮やかで新鮮な方法で視覚化しようとする人々にこのチャートを推奨します。全体として、指標の理解と議論を高め、企業プレゼンテーションでの使用をインパクトあるものにし、記憶に残るものにします。
Download slide
企業向けスライド
PowerPoint
49 Slides
企業向けスライド
Apple Keynote
49 Slides
企業向けスライド
Google Slides
49 Slides
To continue, enter your email:
OR
Already have an account?
Log in
Preview

Full preview (49 Slides)
s