Slide of
企業向けスライド Presentation
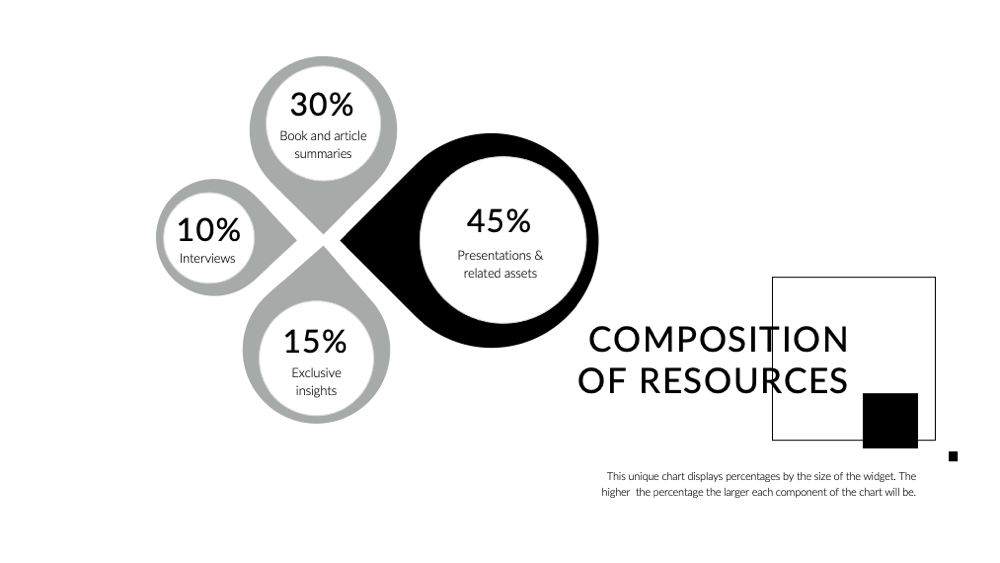
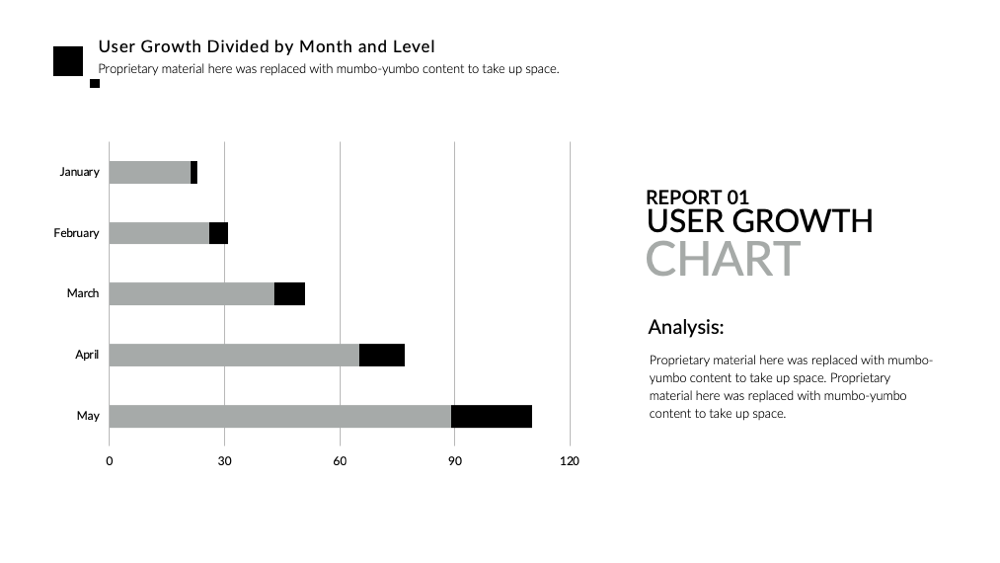
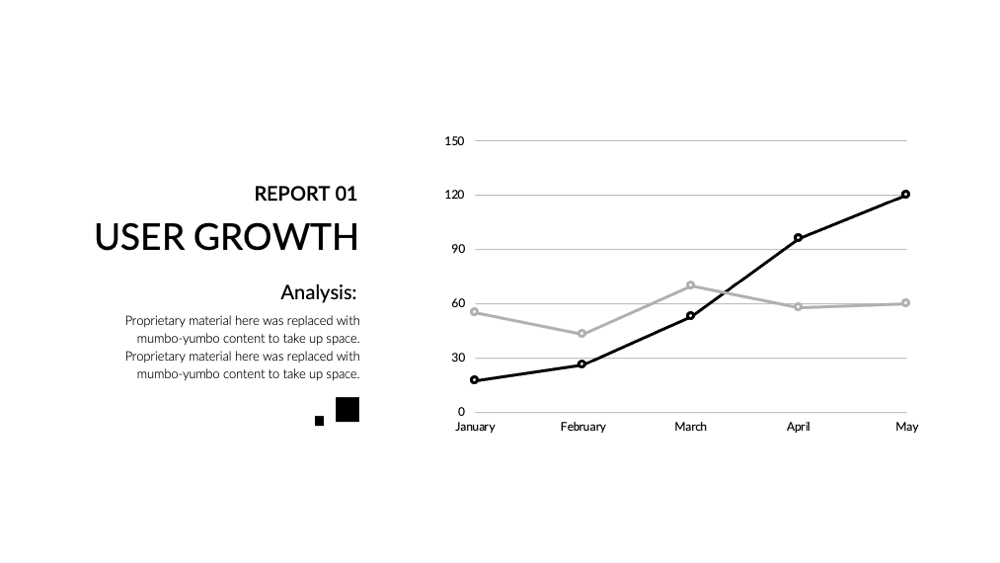
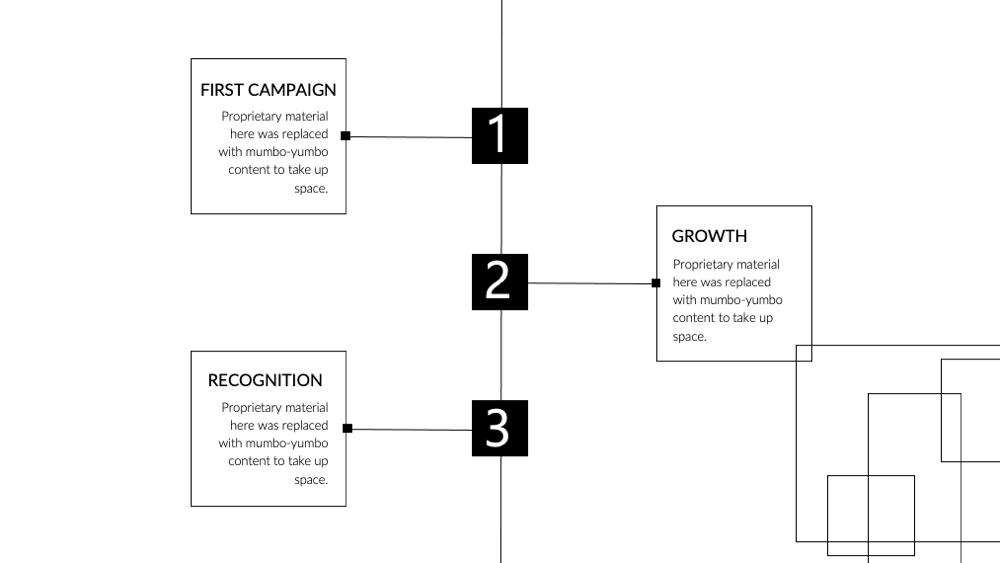
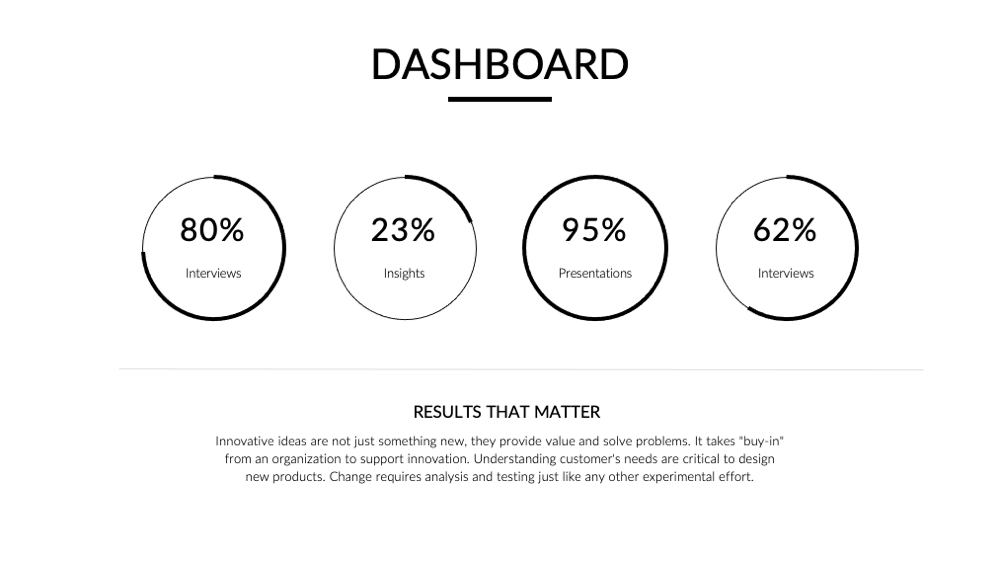
ユーザー成長チャート
'ユーザー成長チャート'スライドを用いて、企業成長の複雑な物語をより深く探求しましょう。これは'コーポレートデッキ'の重要な一部で、円グラフを展示して年間のユーザー成長を包括的に見ることを可能にします。データの詳細な分析を可能にし、動的な成長分析と比較を提供します。チャートのゆっくりとしたアニメーションは、聴衆の注意を引きつけ、手元のデータの詳細な理解を確保し、企業成長の啓蒙的な物語を語ります。これはデータ分析とストーリーテリングの素晴らしい融合です。
Download slide
企業向けスライド
PowerPoint
49 Slides
企業向けスライド
Apple Keynote
49 Slides
企業向けスライド
Google Slides
49 Slides
To continue, enter your email:
OR
Already have an account?
Log in
Preview

Full preview (49 Slides)