Slide of
KPI 대시보드 (파트 1) Presentation
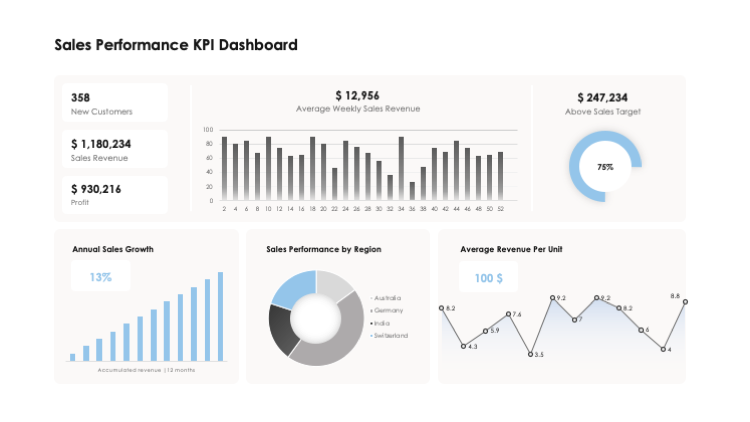
현금 흐름 KPI 대시보드
제목이 '현금 흐름 KPI 대시보드'인 이 슬라이드는 'KPI 대시보드 (파트 1)' 프레젠테이션의 중요한 부분입니다. 이는 관람자에게 현금 흐름과 관련된 주요 성과 지표에 대한 더 나은 이해를 제공하려고 합니다. 수익, 비용, 개별 카테고리와 같은 요소를 다루며, 대시보드는 관련 데이터를 효율적으로 제시합니다. 이는 실제로 어떠한 재무 논의나 분석에도 막대한 가치를 더합니다. 이로 인해 비즈니스 목표와 그에 따른 측정 마커의 신중한 검토에 필수적입니다.
Download slide
KPI 대시보드 (파트 1)
PowerPoint
30 Slides
KPI 대시보드 (파트 1)
Apple Keynote
30 Slides
To continue, enter your email:
OR
Already have an account?
Log in
Preview

Full preview (30 Slides)