Slide of
KPI-Dashboards (Teil 1) Presentation
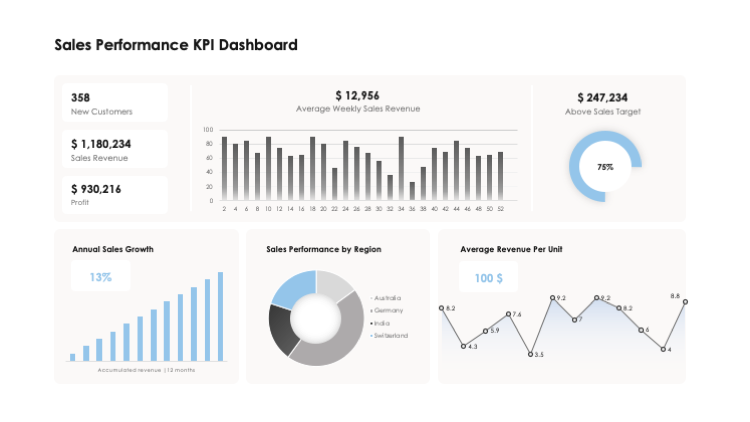
Finanzleistungs-Dashboard
Mit dem Eintauchen in das Wesen der finanziellen Gesundheit deckt die Folie 'Finanzleistungs-Dashboard' im 'KPI Dashboards (Teil 1)' Schlüsselindizes ab, die wertvoll sind, um die Leistung einer Organisation zu entschlüsseln. Es visualisiert prägnant Kennzahlen wie Nettoumsatz, Bruttomarge, Betriebsgewinn und mehr. Mit einem Fokus auf Rentabilität, Liquidität und Hebelwirkung ermöglicht es ein umfassendes Verständnis der finanziellen Stabilität. Es beleuchtet auch die Verkaufsleistung und dient letztendlich als eine bequeme und intuitive Realitätsprüfung für alle, die sich darauf verlassen.
Download slide
KPI-Dashboards (Teil 1)
PowerPoint
30 Slides
KPI-Dashboards (Teil 1)
Apple Keynote
30 Slides
To continue, enter your email:
OR
Already have an account?
Log in
Preview

Full preview (30 Slides)
s