Slide of
Project Proposal Presentation
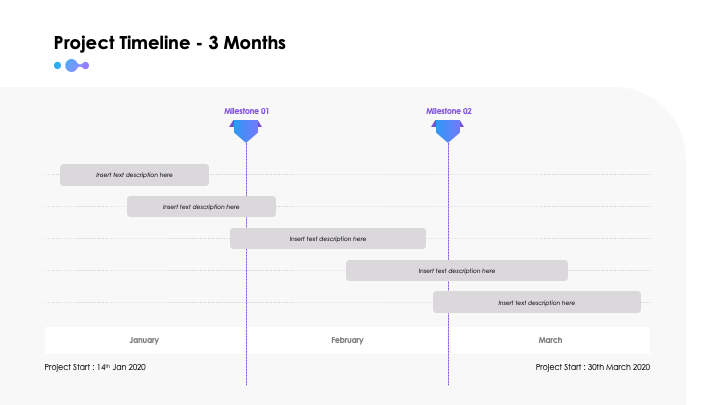
Gantt Chart - 2 Weeks
Encapsulating the essence of task management with the 'Gantt Chart - 2 Weeks' slide from the 'Project Proposal' presentation, the visualisation assists in understanding the project's progress over a two-week period. Using keywords like 'task/activity', 'task name', 'week', and 'text here', the slide lays out a systematic way to monitor individual tasks. This imaginative method aids in the clear communication of planning and deliverables, proving invaluable in rallying team members behind a common vision.
Download slide
DARK VERSION
Project Proposal
Apple Keynote
28 Slides
Project Proposal
Google Slides
28 Slides
Project Proposal
PowerPoint
28 Slides
LIGHT VERSION
Project Proposal
Apple Keynote
28 Slides
Project Proposal
Google Slides
28 Slides
Project Proposal
PowerPoint
28 Slides
To continue, enter your email:
Preview

Full preview (28 Slides)