Slide of
製品ロードマップ Presentation
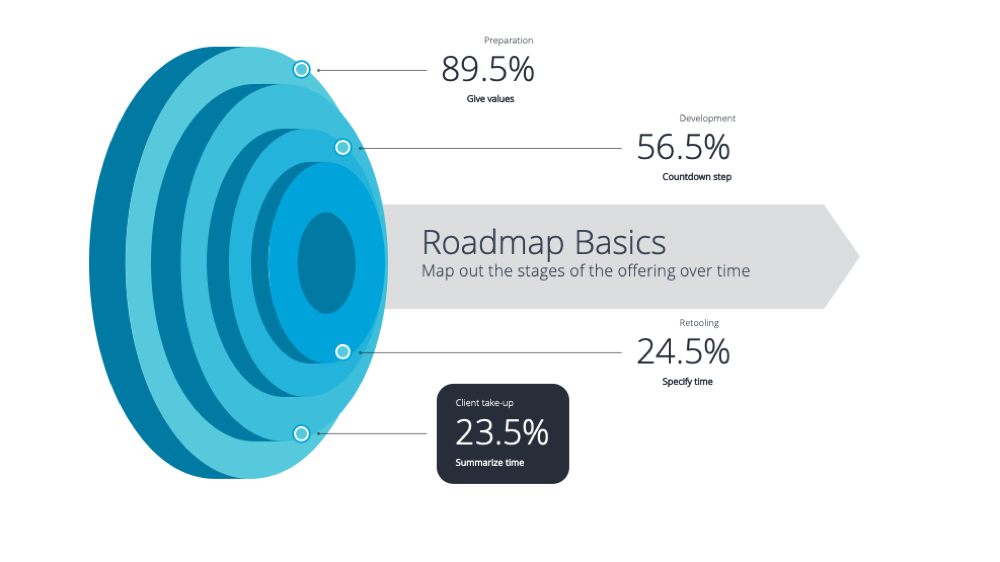
製品メトリクス
'製品メトリクス'の詳細な情報を明らかにするこのスライドは、インタラクティブな視覚化を通じて包括的なイメージを描き出します。これには、製品のKPIを一目で理解するための円グラフや棒グラフが含まれます。'製品ロードマップ'のプレゼンテーション内に配置されたこのスライドは、製品マネージャー、プロジェクトマネージャー、またはエグゼクティブが製品の旅を定義する主要なメトリクスを把握するための重要なガイドとなります。それは次に製品が向かうべき方向の戦略的な監督を助ける一歩となります。
Download & customize
製品ロードマップ
PowerPoint
39 Slides
製品ロードマップ
Apple Keynote
39 Slides
製品ロードマップ
Google Slides
39 Slides


Join You Exec
Access the full library of business templates

Get full access

Try for free
Download our free templates each week
No credit card required
OR
Already have an account?
Log in
Preview
Full preview (39 Slides)