resource preview
resource preview
resource preview
resource preview
resource preview
resource preview
resource preview
resource preview
resource preview
resource preview
resource preview
resource preview
resource preview
resource preview
resource preview
resource preview
resource preview
resource preview
resource preview
resource preview
resource preview
resource preview
resource preview
resource preview
resource preview
resource preview
resource preview
resource preview
resource preview
resource preview
resource preview

Download and customize this and 500+ other business templates

Start here ⬇️

Voila! You can now download this Presentation

Download

Explainer

Preview

सारांश

क्या आपकी टीम आपके सबसे महत्वपूर्ण व्यावसायिक उद्देश्यों को पूरा करने में संघर्ष करती है? KPI और प्रदर्शन मापदंड उच्चाधिकारियों के लिए महत्वपूर्ण हैं क्योंकि वे संगठनात्मक जिम्मेदारी बनाते हैं जो सबसे अधिक आवश्यक हैं महत्वपूर्ण लक्ष्यों को प्राप्त करने के लिए। KPI और प्रदर्शन मापदंड प्रस्तुति टेम्पलेट डाउनलोड करें ताकि आपकी टीम के सदस्यों को सिंक करें, व्यक्तिगत सदस्यों में आत्मनिर्भरता डालें, और निर्णय लेते समय महत्वपूर्ण लक्ष्यों को ध्यान में रखें। टेम्पलेट में आपूर्ति श्रृंखला डैशबोर्ड, प्रोजेक्ट प्रबंधन डैशबोर्ड, विपणन डैशबोर्ड, और कर्मचारी प्रदर्शन डैशबोर्ड, सहित वित्तीय प्रदर्शन, विज्ञापन, प्रोजेक्ट विपणन, संचालन प्रदर्शन मापदंड, संतुलन स्कोरकार्ड और प्रोजेक्ट प्राथमिकता त्रियाज, और अन्य कई डैशबोर्ड शामिल हैं।

stars icon
5 questions and answers
info icon

Yes, KPIs and other performance metrics can be compared in terms of their effectiveness. KPIs, or Key Performance Indicators, are specific and often quantifiable measures that an organization uses to track its progress towards a defined goal. Other performance metrics, while also used to track progress, may not be as closely tied to key business objectives. KPIs tend to be more strategic, focusing on long-term performance and overall organizational success, while other performance metrics may be more operational, focusing on short-term performance in specific areas. However, both are crucial for a comprehensive understanding of an organization's performance.

The KPI and Performance Metrics presentation template can help in keeping critical goals top of mind by creating a visual representation of key performance indicators and metrics. This allows team members to easily understand and track progress towards these goals. The template also fosters organizational accountability, as it clearly outlines what is needed to reach these critical goals. Furthermore, it can instill self-reliance in individual team members, as they can see how their individual contributions align with and impact the overall objectives.

Key Performance Indicators (KPIs) play a crucial role in creating organizational accountability. They provide a measurable way to evaluate the success of an organization, department, or individual in achieving their objectives. By setting clear, quantifiable targets, KPIs ensure that everyone in the organization understands what is expected of them and what they need to achieve. This creates a culture of accountability, as individuals and teams are held responsible for meeting these targets. Furthermore, KPIs allow for performance tracking and provide a basis for constructive feedback, enabling continuous improvement.

View all 5 questions
stars icon Ask follow up

Download and customize this and 500+ other business templates

Start here ⬇️

Voila! You can now download this Presentation

Download

उपकरण की विशेषताएं

आपूर्ति श्रृंखला डैशबोर्ड

जब उच्चाधिकारी अपनी आपूर्ति श्रृंखला का ट्रैक करते हैं, तो वे अपने ज्ञान को बढ़ाते हैं कि कैसे परिवर्तन लाभ मार्जिन पर प्रभाव डालते हैं, जो सबसे महत्वपूर्ण KPIs में से एक है। उदाहरण के लिए, यदि लाभ मार्जिन घटना शुरू हो जाता है लेकिन आपूर्ति लागत बढ़ जाती है, तो यह एक प्रमुख लाल झंडा हो सकता है।

इस आपूर्ति श्रृंखला डैशबोर्ड में, उच्चाधिकारी आपूर्ति श्रृंखला लागत, आपूर्ति श्रृंखला लागत बनाम बिक्री, इन्वेंटरी तक बिक्री का अनुपात, और इन्वेंटरी की वहन करने की लागत को माप सकते हैं। यह आपूर्ति श्रृंखला लागत दृश्यीकरण आपको एक नजर में मदद करता है जो लागत सबसे बड़ी है, और इसे कंपनी या टीम की बिक्री के खिलाफ मापा जा सकता है और उद्योग के औसत के साथ तुलना की जा सकती है।चूंकि इन्वेंटरी अक्सर किसी कंपनी का सबसे बड़ा खर्च होता है, इसलिए इन्वेंटरी से बिक्री के अनुपात और इन्वेंटरी की वहन की लागत को भी रेखा और बार ग्राफ के साथ मापा जा सकता है।

stars icon Ask follow up

एक याद दिलाने के लिए, ये डैशबोर्ड सभी Excel शीट्स से जुड़ते हैं जहां निर्वाहक अपना डाटा डालते हैं। इस टेम्पलेट में दिए गए उदाहरण में तीन साल का डाटा है, लेकिन निर्वाहक इस शीट को संपादित करके इस रेंज को कम या बढ़ा सकते हैं। (स्लाइड 5)

resource image

वैश्विक वित्तीय प्रदर्शन

एक अलग दृश्यरचना KPIs को वैश्विक वित्तीय प्रदर्शन, आदेशों के साथ उनकी स्थिति और तिथि, इन्वेंटरी का आकार, दैनिक आदेशों की मात्रा और मासिक आपूर्ति श्रृंखला की लागत के अच्छ्रेत्र में भी शामिल होती है। (स्लाइड 6)

मत भूलिए, आप इन डैशबोर्ड्स के शीर्षकों को बदल सकते हैं, जैसा कि आप चाहते हैं कि उन्हें मापा जाए, क्योंकि वे सभी पूरी तरह से अनुकूलनीय हैं

resource image

प्रोजेक्ट प्रबंधन डैशबोर्ड

प्रोजेक्ट प्रबंधकों और कार्यकारी दलों के लिए, KPIs एक प्रगति रिपोर्ट की तरह होते हैं जिसका उपयोग सफलता को मापने के लिए किया जाता है। हालांकि, KPIs केवल पिछले प्रदर्शन समीक्षाओं के लिए नहीं होते। सर्वश्रेष्ठ PMs KPIs का उपयोग अपने लक्ष्यों की प्राप्ति की प्रगति को वास्तविक समय में मापने के लिए करते हैं।

stars icon
5 questions and answers
info icon

Tracking active projects with a Gantt chart and project status slider can significantly enhance business strategy. Firstly, it provides a visual representation of the project timeline, including the start and end dates of individual tasks. This helps in identifying any dependencies between tasks and understanding the overall project flow. Secondly, it allows for real-time tracking of project progress. If a task is falling behind schedule, it can be immediately identified and corrective actions can be taken. This proactive approach helps in avoiding delays and ensures timely completion of projects. Lastly, it aids in resource allocation. By knowing the status and timeline of each task, resources can be effectively allocated and managed. All these factors contribute to a more efficient and effective business strategy.

A project management dashboard is a specific type of business performance metric. It provides a visual representation of a project's progress and performance, allowing project managers to track active projects, compare planned completion of tasks against actual completion, and identify potential issues. Other business performance metrics, such as Key Performance Indicators (KPIs), may focus on different aspects of business performance, such as financial performance, customer satisfaction, or operational efficiency. While a project management dashboard is a tool for managing specific projects, other business performance metrics provide a broader view of the organization's overall performance.

Yes, there are numerous case studies that demonstrate the effectiveness of using a project management dashboard. These dashboards provide a visual representation of project progress, tasks, and performance metrics, which can greatly enhance project management efficiency. They allow project managers to track active projects, compare planned completion of tasks against actual completion, and identify potential issues early. For instance, if the planned productivity exceeds the actual productivity, it indicates that the team is behind schedule. On the other hand, if the actual productivity exceeds the planned one, it means the project is on track. Therefore, project management dashboards are a valuable tool for ensuring project success.

View all 5 questions
stars icon Ask follow up

इस प्रोजेक्ट प्रबंधन डैशबोर्ड का उपयोग सक्रिय प्रोजेक्ट्स को ट्रैक करने के लिए एक Gantt चार्ट और प्रोजेक्ट स्थिति स्लाइडर के साथ किया जा सकता है। एक Burndown चार्ट कार्यों की योजनाबद्ध समाप्ति की तुलना में वास्तविक समाप्ति को तुलना करता है।नीली रेखा योजनाबद्ध उत्पादकता है, या कार्यों की संख्या, जबकि हरी रेखा वास्तविक कार्यों की संख्या है। यदि योजना वास्तविक से अधिक होती है, तो टीम समय सारिणी से पीछे है, लेकिन यदि वास्तविक योजना से अधिक होती है, तो आप अच्छी स्थिति में हैं।

stars icon Ask follow up

कार्यों की संख्या और कुल घंटों का बार चार्ट पीएम्स को यह समझने में मदद करता है कि कार्य उनकी उत्पादकता योजना से क्यों कम हो रहे हैं - शायद किसी विशेष कार्य के लिए पर्याप्त घंटे समर्पित नहीं हैं, उदाहरण के लिए। (स्लाइड 14)

resource image

विपणन डैशबोर्ड

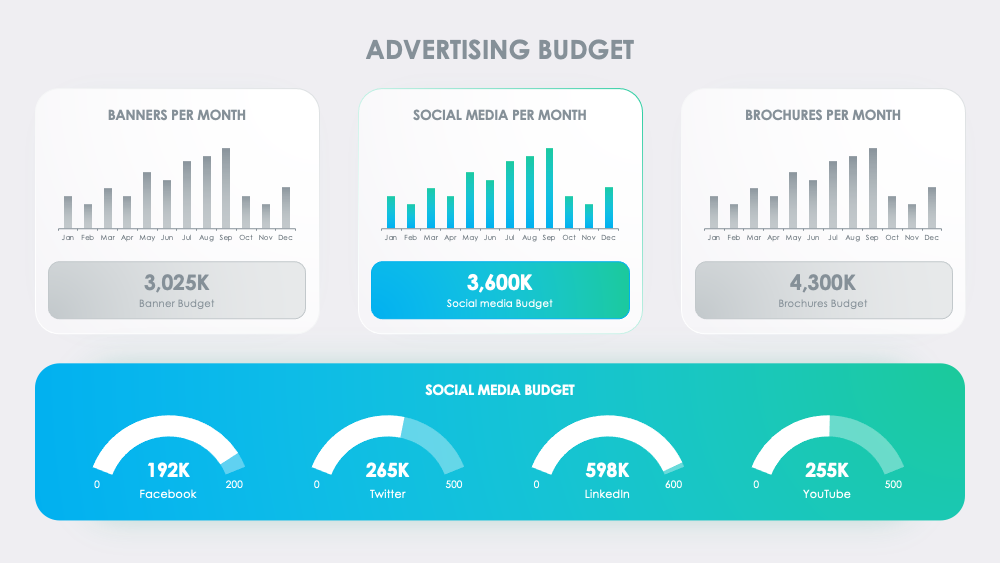
विपणन अक्सर कार्यकारी और कंपनियों के लिए एक प्रमुख विकास बोतलगर्द हो सकता है। एक विशाल खर्च के रूप में, यदि इसे ठीक से ट्रैक नहीं किया जाता है, तो यह हजारों या शायद लाखों डॉलर जला सकता है। यह विशेष रूप से सामाजिक विज्ञापन खर्च के लिए सच है, जहां आरओआई को ट्रैक करना महत्वपूर्ण होता है ताकि प्रतिलिपि और लक्ष्यबद्धता को समायोजित किया जा सके।

stars icon Ask follow up

यह विपणन डैशबोर्ड सामाजिक विज्ञापन खर्च से उत्पन्न होने वाले पसंद और संलग्नता पर केंद्रित है। शीर्ष खंड में एक निर्धारित समयावधि के दौरान प्रमुख सामाजिक प्लेटफार्मों पर कुल पसंद और संलग्नता को ट्रैक करता है। एक रेखा ग्राफ आपके विभिन्न विज्ञापनों में विज्ञापन खर्च का विवरण देता है जिसमें आपके सर्वाधिक प्रदर्शन के लिए खिंचने योग्य टिप्पणी होती है।

stars icon Ask follow up

दाहिने हाथ के डैशबोर्ड पर नंबर विज्ञापन खर्च और वापसी से संबंधित महत्वपूर्ण वित्तीय मापदंडों को उजागर करते हैं। शीर्ष बाएं में आपका कुल बजट है, नीचे खर्च की गई राशि है, और मध्य दाएं में आपकी उत्पन्न आय है।इस उदाहरण में, आय ने 62% की रॉय की ओर नेतृत्व किया (जो निचले बाएं कोने में है)। (स्लाइड 21)

resource image

कर्मचारी प्रदर्शन डैशबोर्ड

जबकि प्रबंधक और अधिकारी व्यावसायिक KPIs का पालन करते हैं, उन्हें व्यक्तिगत स्तर पर प्रदर्शन का भी पालन करने की आवश्यकता होती है। इस कर्मचारी प्रदर्शन डैशबोर्ड में, बाईं ओर कर्मचारी मूल्यांकन स्कोरबोर्ड का उपयोग बेंचमार्किंग के उद्देश्यों के लिए कर्मचारी प्रदर्शन को ग्रेड करने के लिए किया जा सकता है। मध्य में बार चार्ट का उपयोग कर्मचारी मूल्यांकन स्कोर को दृश्यमान करने के लिए किया जा सकता है।

stars icon
1 questions and answers
info icon

KPIs (Key Performance Indicators) are essential for measuring performance and progress towards a company's goals. Here are some steps to work with KPIs:

1. Define your goals: Before you can set KPIs, you need to have a clear idea of your business objectives.

2. Identify the key performance indicators for each goal: These should be measurable and directly related to your goals.

3. Set targets for each KPI: These targets should be realistic and achievable.

4. Monitor your KPIs: You should regularly review your KPIs to ensure you are progressing towards your goals.

5. Adjust your KPIs as necessary: If you are not progressing towards your goals as expected, it may be necessary to adjust your KPIs.

Remember, KPIs are just a tool. They do not replace managerial judgment and experience, but they can provide valuable guidance and feedback.

stars icon Ask follow up

दाईं ओर एक और स्कोरबोर्ड अन्य स्कोरिंग क्षेत्रों का विवरण देता है जहां टीमों का मूल्यांकन कार्य की गुणवत्ता और मात्रा, कार्य क्षमता, या पहले संपर्क और समाप्ति के बीच अपने बिक्री चक्र अवधि को कम करने जैसे अधिक विशिष्ट कार्यों के आधार पर किया जाता है। दाईं या बाईं तीर सुधार में वृद्धि या सुधार में कमी को प्रदर्शित करते हैं। (स्लाइड 30)

stars icon Ask follow up
resource image

लाभ

आपके लक्ष्यों के अनुरूप और आपकी वर्तमान सीमाओं के भीतर प्राप्य होने वाले, प्रासंगिक, मापनीय KPIs के साथ, आप मनोबल, पारदर्शिता, टीम समन्वय, और समग्र सफलता दर में सुधार कर सकते हैं। लक्ष्यों का निर्माण करें फिर उनका कार्यान्वयन मापें, मापनीय उद्देश्यों के आधार पर मजबूत निर्णय लें, और वास्तव में हर व्यावसायिक उपयोग के लिए अद्वितीय दृश्यमानताओं के साथ समझने में आसान KPI डैशबोर्ड्स के साथ अपने लक्ष्यों को प्राप्त करें।

stars icon Ask follow up

Download and customize this and 500+ other business templates

Start here ⬇️

Voila! You can now download this Presentation

Download