Slide of
Business Case Study Presentation
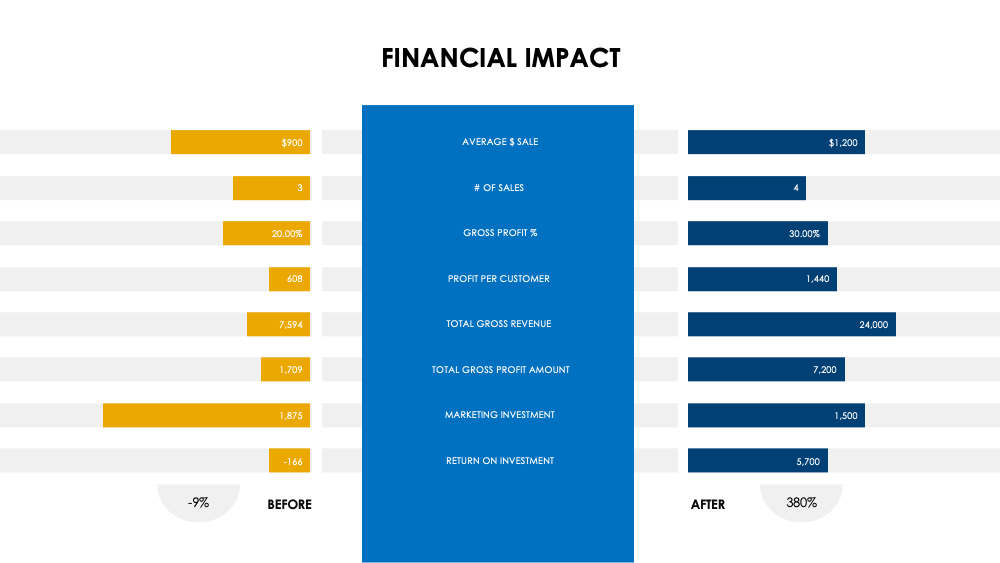
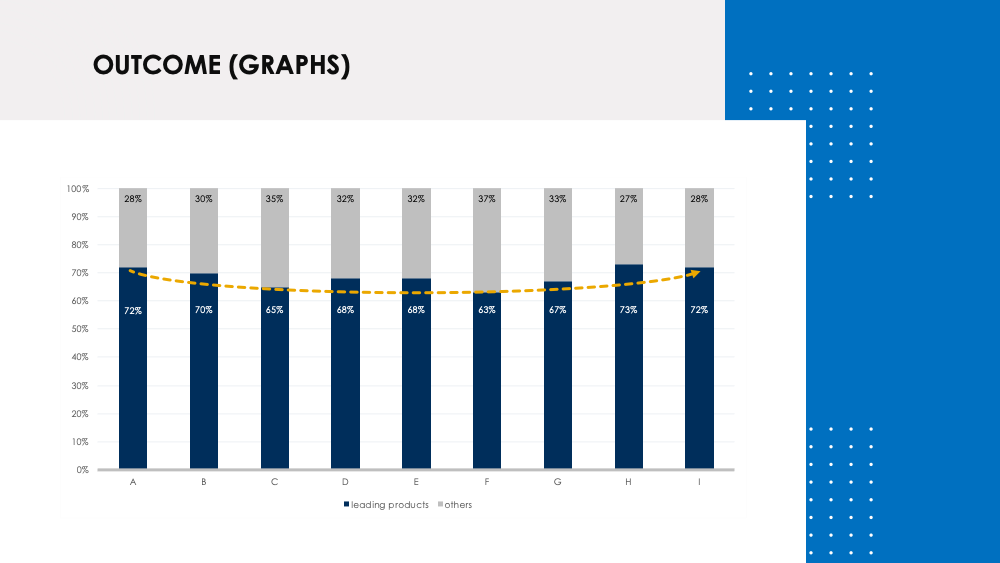
Kpis And Deliverables
Encapsulating active and inactive aspects through expressive bar graphs and charts, the 'Kpis And Deliverables' slide features in the 'Business Case Study' presentation. It leverages real-life case studies to illustrate the potency of the team's products or services. A standout segment of the presentation, this slide offers a comprehensible visual display of metrics pertaining to critical deliverables. Such a setup aids in underlining the distinction between achieved and pending deliverables, making it a solid tool for the learners to appreciate business complexities.
Download & customize
Business Case Study
PowerPoint
55 Slides
Business Case Study
Apple Keynote
55 Slides
Business Case Study
Google Slides
55 Slides


Join You Exec
Access the full library of business templates

Get full access

Try for free
Download our free templates each week
No credit card required
Preview
Full preview (55 Slides)